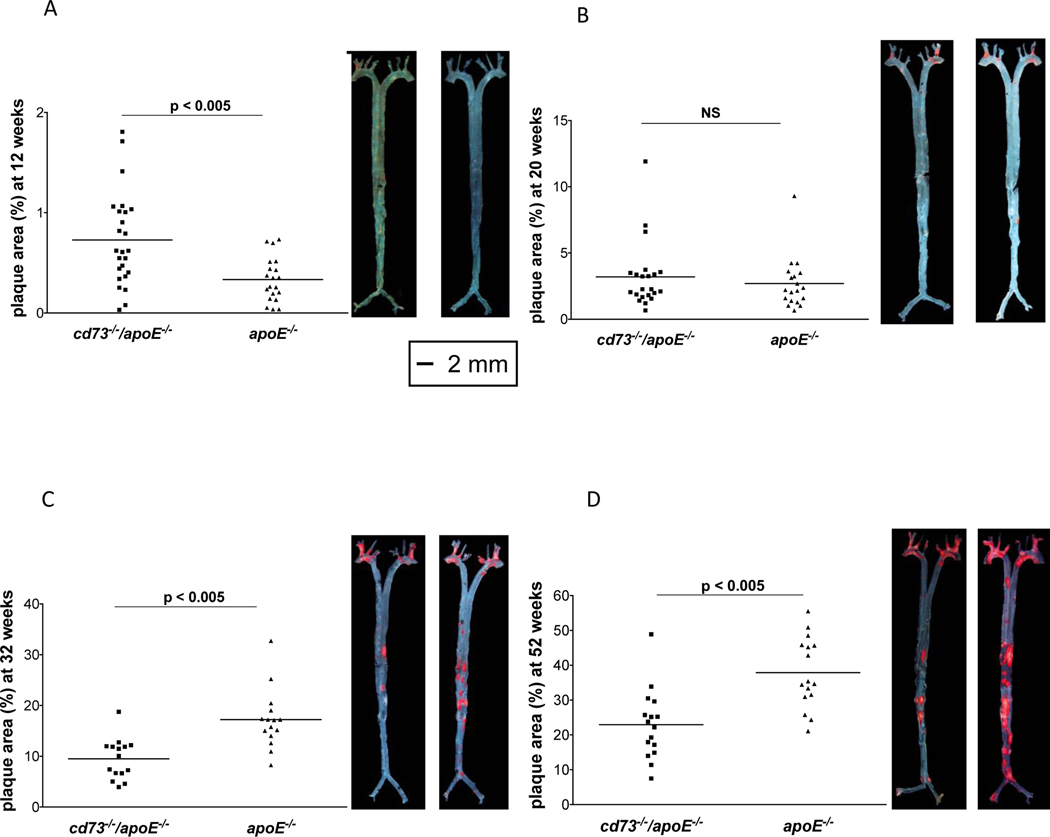
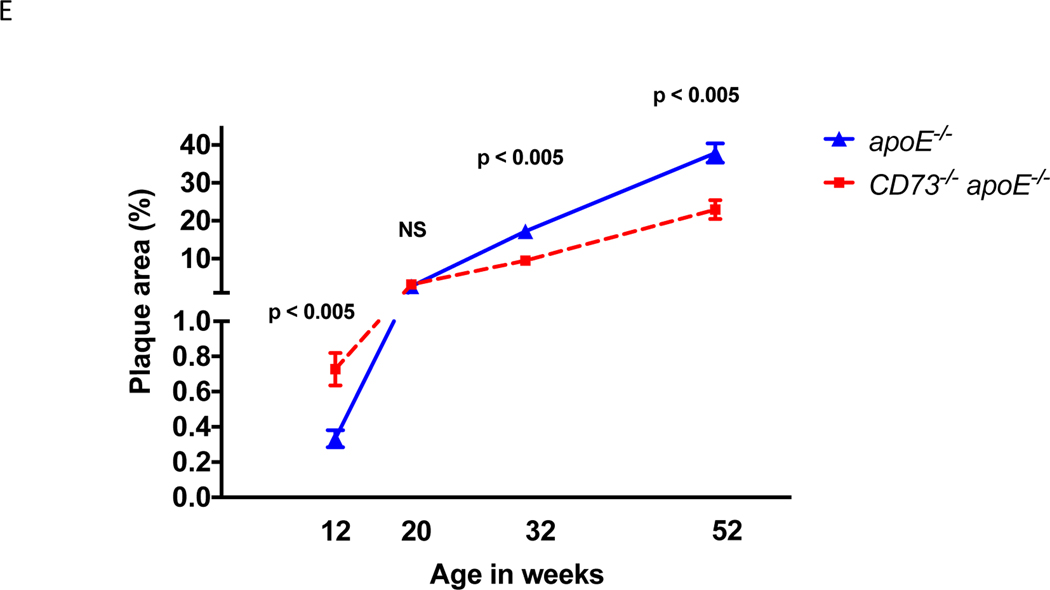
Figure 1.
Reversal of atherosclerotic phenotype over time. All experiments were performed in mice of an Apolipoprotein E-deficient, hyperlipidemic background. All mice were a fed normal laboratory diet containing 4.5% fat. Mouse aortas were isolated, oil red O stained and pinned en face to quantify the percent of the total vessel area covered by plaque. Each point represents the percent of plaque coverage of the entire aorta for one mouse with representative photographs for each group shown on the right. Note the different scales of the graphs. (A) 12 weeks, (B) 20 weeks, (C) 32 weeks, and (D) 52 weeks. (E) synopsis of graphs a-d showing plaque growth over time and the reversal of phenotype around 20 weeks of age, leading to less plaque in cd73−/−/apoE−/− mice than in apoE−/− at 32 and 52 weeks of age.


