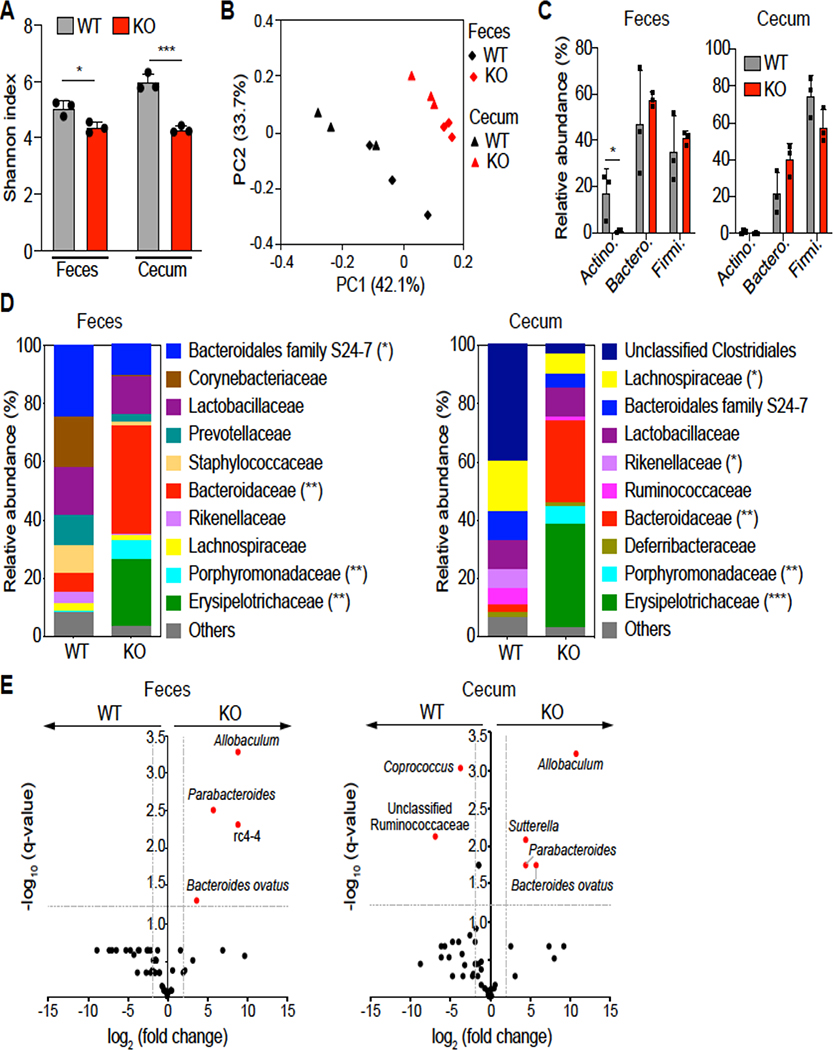
Figure 3. Loss of DRA alters gut microbial composition.
(Figure A) Shannon index measuring bacterial diversity by 16S rRNA sequencing in the feces and cecal contents of DRA KO and WT mice (n=3). (Figure B) Weighted Unifrac principal coordinate analysis (PCoA) plot separating fecal and cecal microbiota composition between DRA KO and WT mice. (Figure C) Top phylum abundance in the feces and cecal contents. (Figure D) Top family abundance of fecal and cecal microbes. Asterisks (*) indicate statistical significance between the groups of mice. (Figure E) Significantly different taxa between DRA KO and WT mice in fecal and cecal samples in red. The dashed lines represent thresholds (log2 fold change > 1, FDR P <0.05). *p <0.05, **p <0.01, ***p <0.001.

