
Figure 1. Design and characterization of CDN.
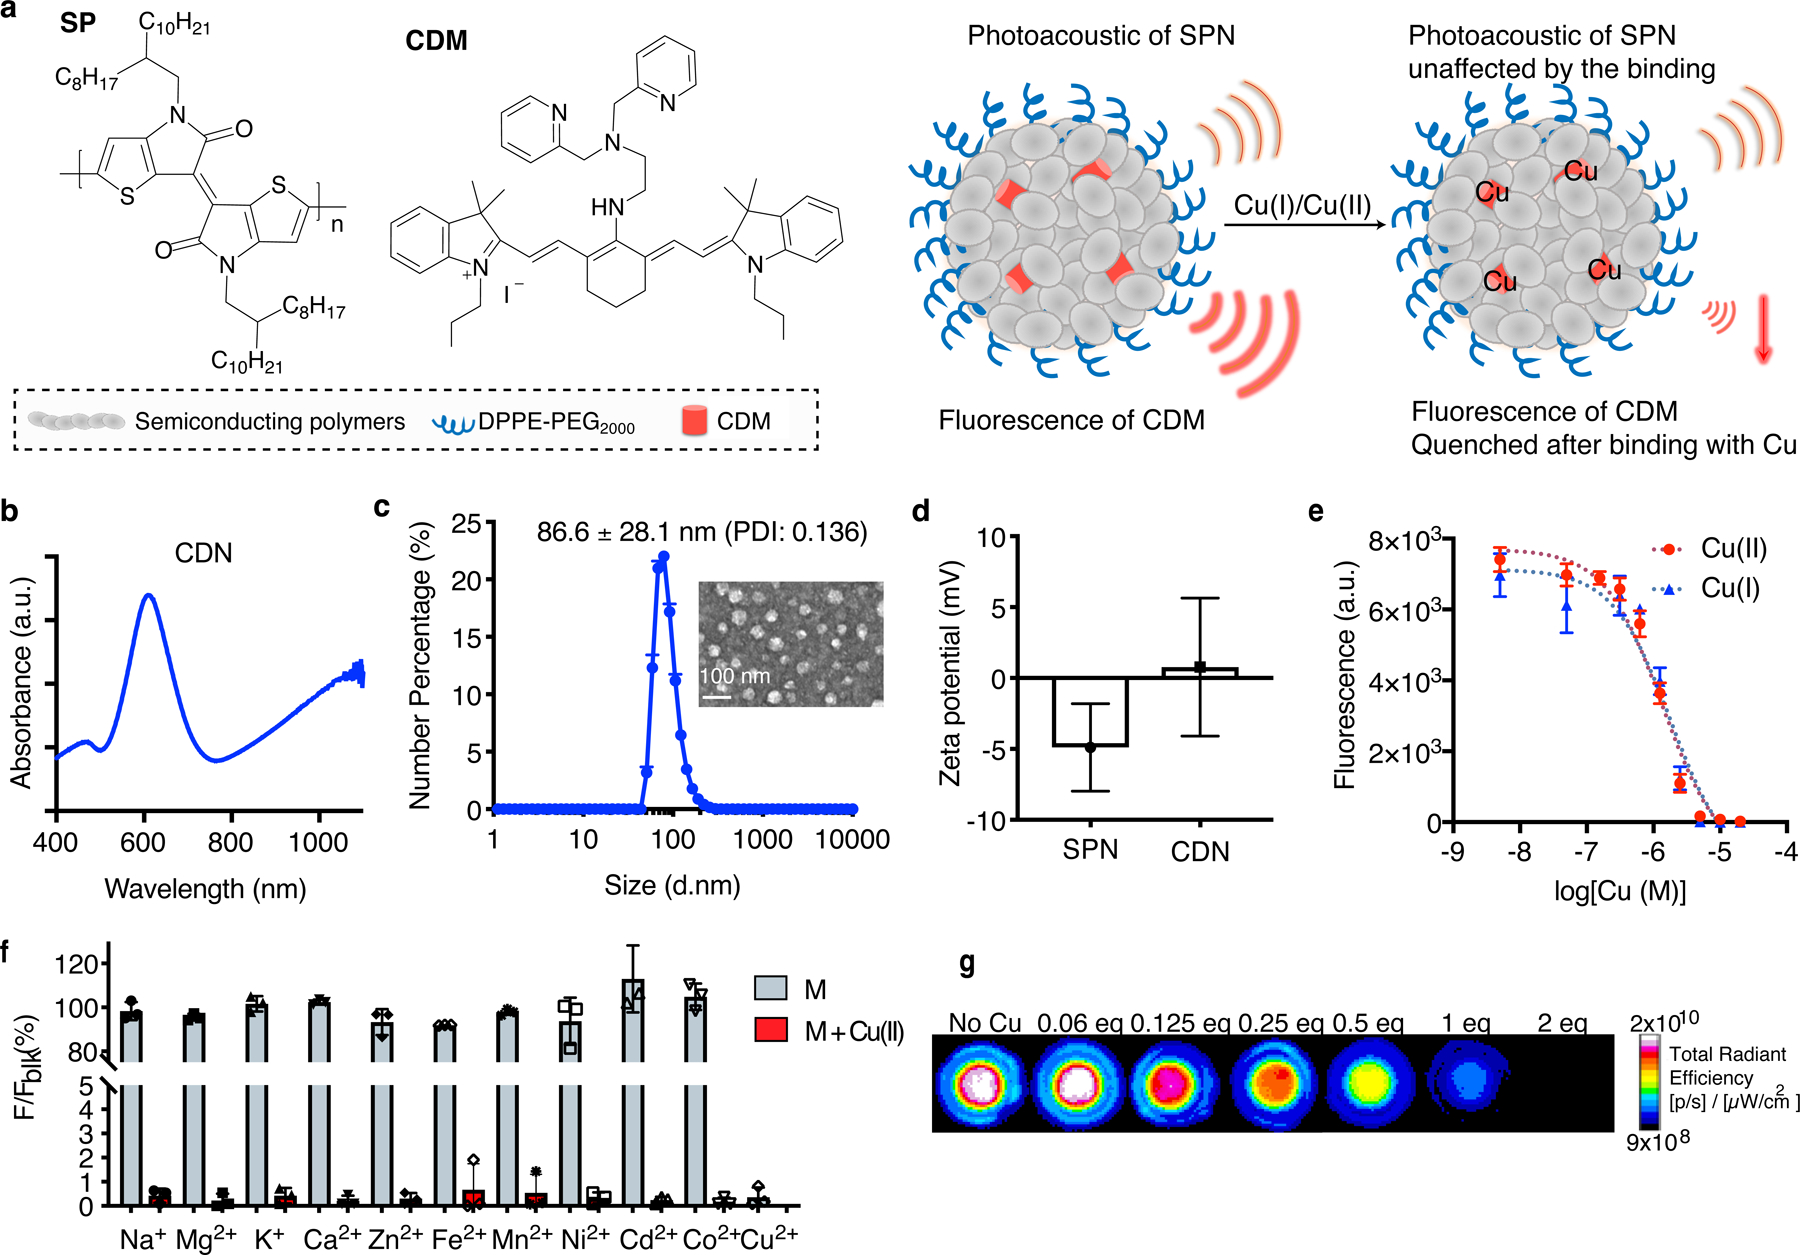
(a) Molecular components of CDN and the illustrated nanoparticle formulation. When binding with Cu(I) or Cu(II), the fluorescence of CDM is quenched but the photoacoustic signal from the semiconducting polymer remains unchanged, allowing for quantitative analysis of the chelation process. (b) UV-Vis spectrum of CDN. CDM absorption peaks at 610 nm and the polymer peaks at 1100 nm. (c) Size and morphology of CDN measured by DLS (mean ± s.e.m., n=4 independent experiments) and TEM imaging (n=2 independent experiments, 2 images acquired per experiment). Inset: TEM image of CDN with uranyl acetate staining (scale bar: 100 nm). PDI: polydisperse index. (d) Zeta potential measurement of SPN with or without CDM loading (mean ± s.d., n=5 independent samples for SPN and n=4 independent samples for CDN). (e) Fluorescence signal changes of CDN (CDM: 1 μM, Em: 760 nm) upon binding with Cu(I) or Cu(II) in buffered solution (mean ± s.d., n=3 independent samples). (f) Percentage of fluorescence signal of CDN solution (CDM: 5 μM) after mixing with various metal ions to that without metal addition (Na+: 5 mM, Mg2+: 5 mM, K+: 5 mM, Ca2+: 5 mM, Zn2+: 100 μM, Fe2+: 20 μM, Mn2+: 1 μM, Ni2+: 0.5 μM, Cd2+: 0.5 μM, Co2+: 0.5 μM) (mean ± s.d., n=3 independent samples). Concentrations of the tested metal ions are selected based on the physiological abundancy. Blue: measurement after CDN mixing with indicated physiologically abundant or trace metal ions; red: measurement after addition of extra 5 μM of Cu(II) to previous mixture of CDM and metal ions. (g) Representative fluorescence imaging of CDN mixed with different equivalents of Cu(I) in the agar phantom (n=3 independent samples). Signal intensity is normalized based on the photoacoustic signal at 1100 nm for each well.