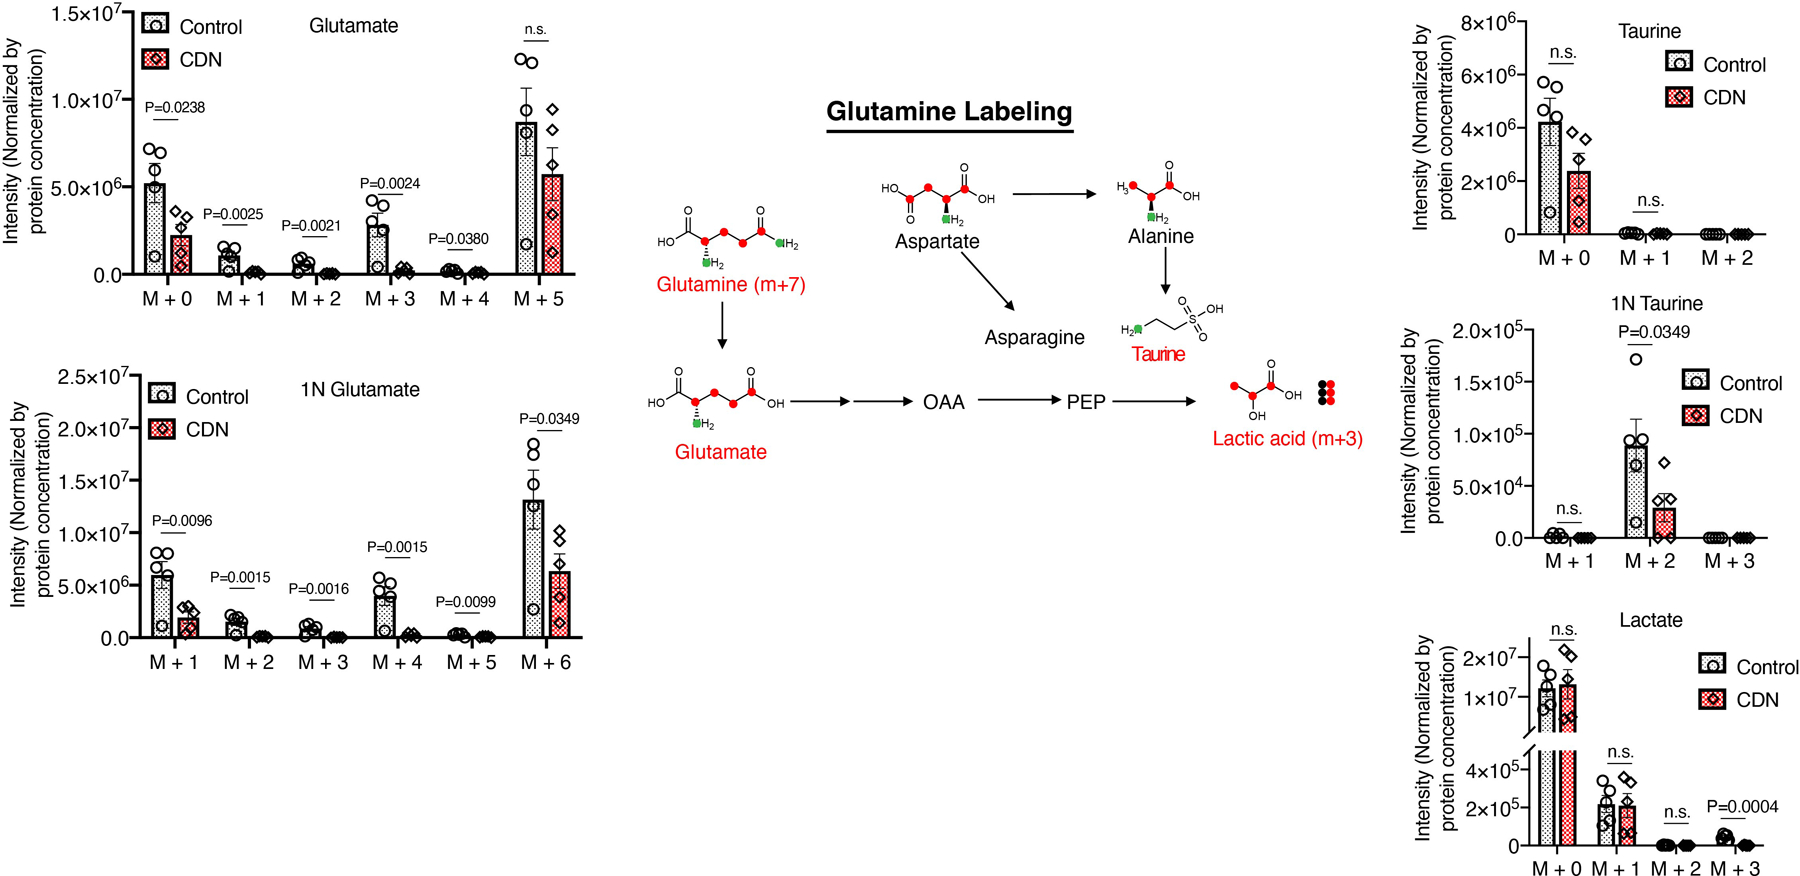
Extended Figure 6. Intensities of isotopologues of metabolites (lactic acid, glutamate, asparagine, and taurine) produced from 13C515N2-labeled glutamine in vitro and illustration of the corresponding pathways through which these metabolites are produced.

Metabolites with isotopologues shown are written in red. Other important intermediate metabolites are written in black. Non-labeled 12C and 14N are shown as black-filled circles while labeled 13C are shown as red-filled circles and labeled 15N are shown as green-filled circles. Raw intensities are normalized by both the protein concentration. Data are shown as mean ± s.e.m. (n = 5 for biologically independent samples, P values from unpaired t test, two-tailed).
