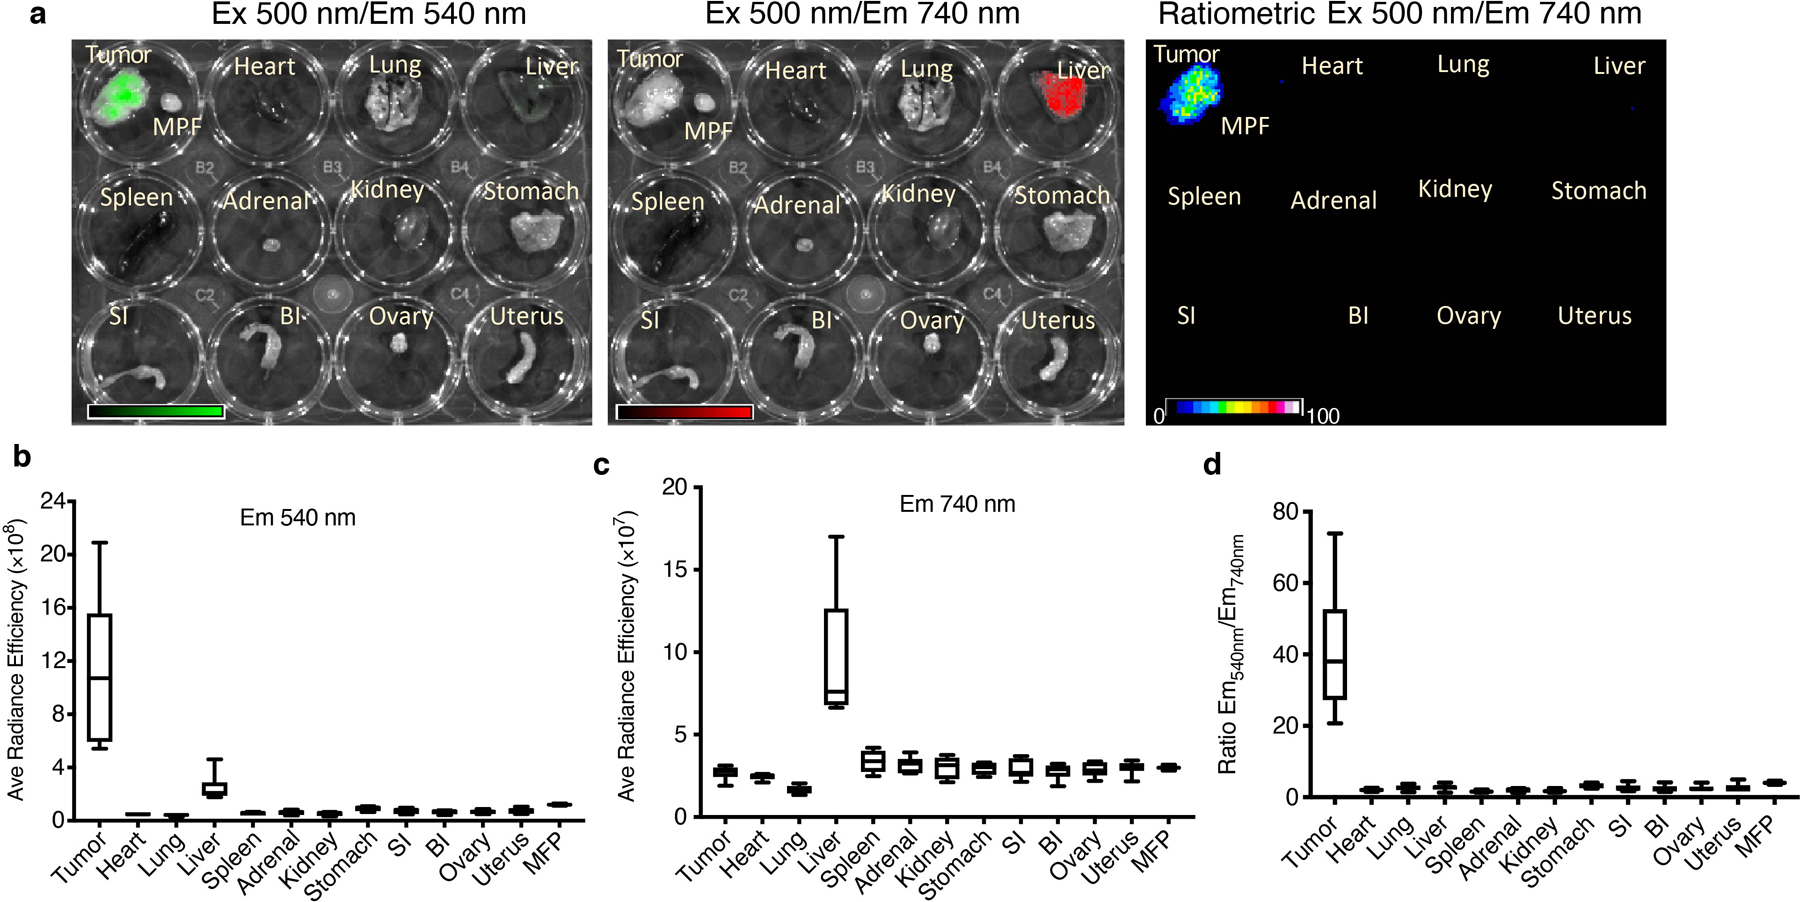
Extended Figure 7. Ex vivo imaging of MDA-MB-231 tumor bearing mice administered with fCDN.

Nude mice bearing orthotopic MDA-MB-231 tumors were injected i.v. with fCDN (CDM dose: 1.35 mg/kg, n=6 independent animals). At 24 h after injection, mice were sacrificed, and major organs were collected and imaged with IVIS. (a). Representative images of ex vivo imaging emitted at 540 nm and 740 nm (excited at 500 nm). The ratiometric fluorescence graphs were shown as Em540/Em740. Average fluorescence efficiency from all organs was quantified at the (b) 540 nm emission (from the SPN group) and (c) 740 nm emission (from the CDM group). (d) The ratio of fluorescence emission between 540 nm and 740 nm. For all the boxplots: center line, median; box limits, first and third quartiles; whiskers, min to max values.
