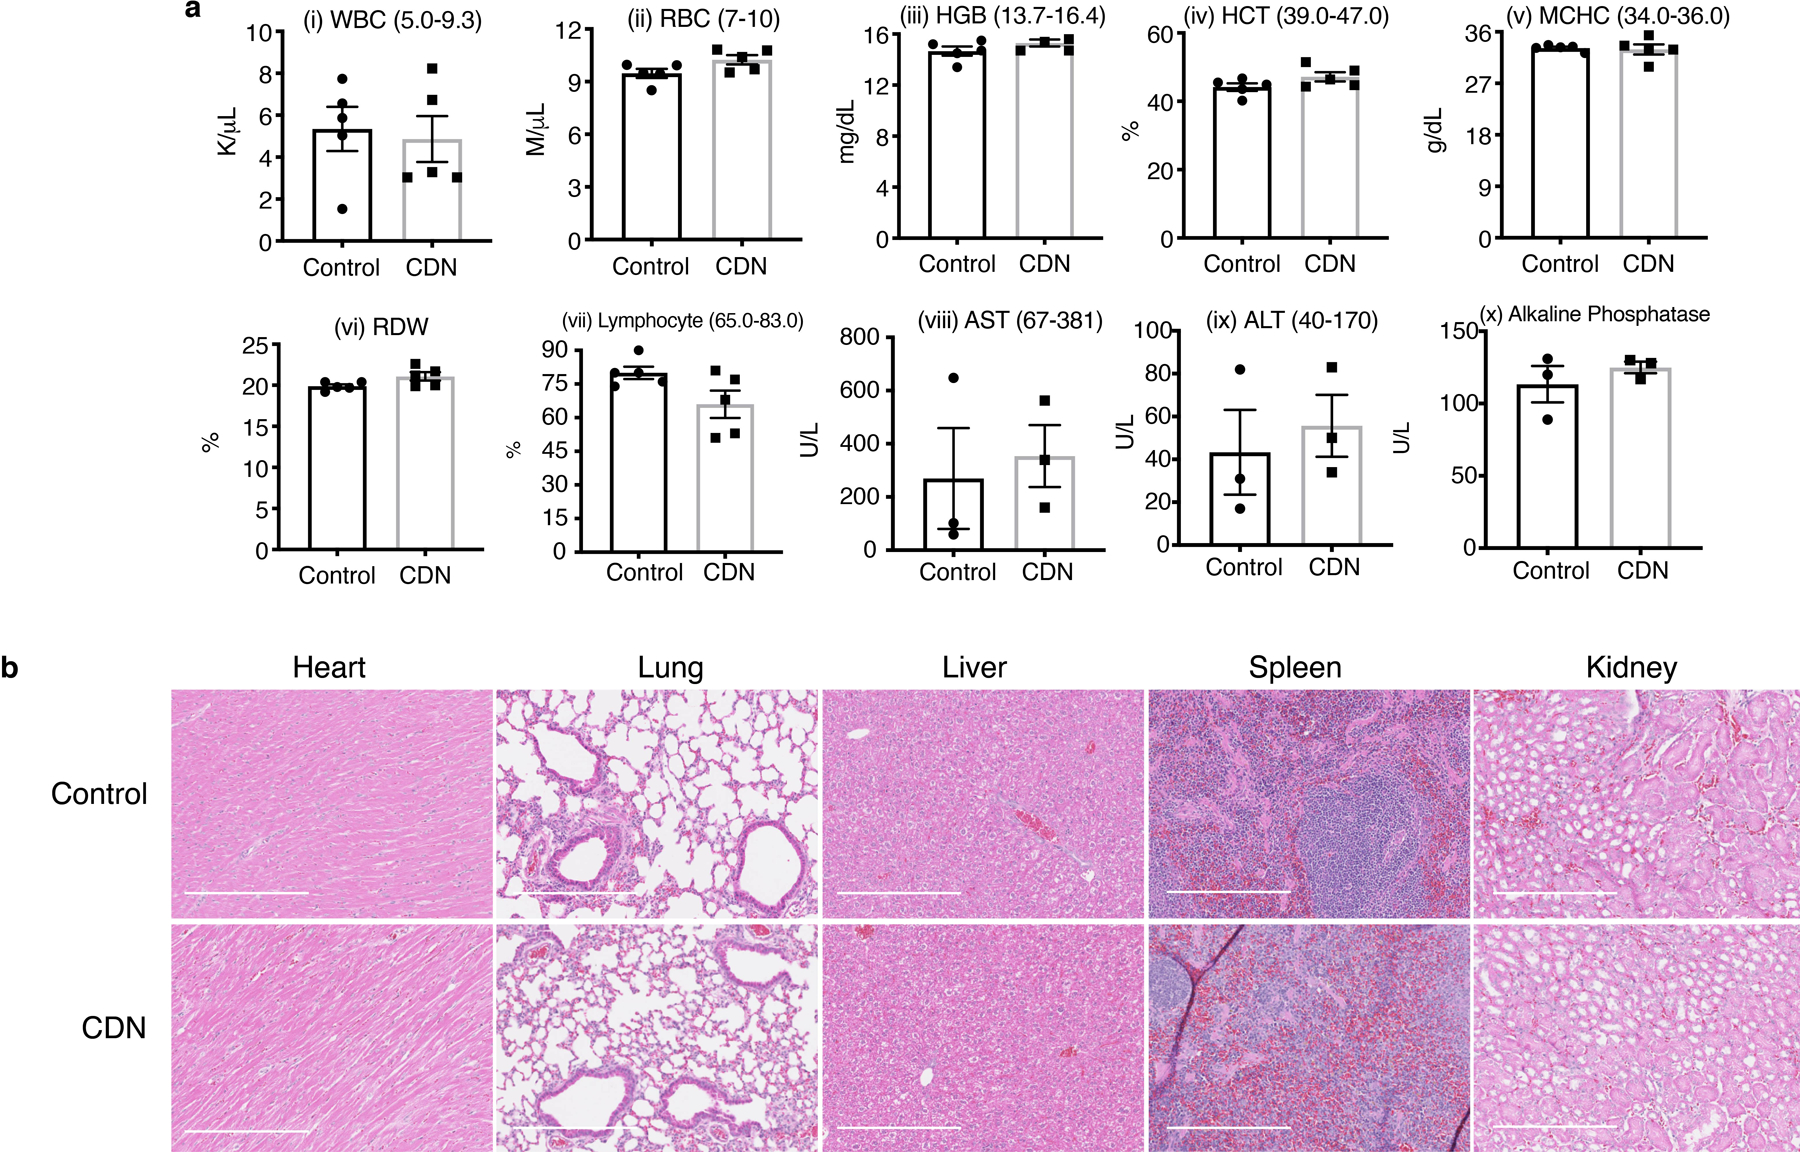
Extended Figure 8. Cumulative toxicity profile for CDN.

(a) Hematological (i-vii) and liver panel (viii-x) analysis of mice after receiving either saline or CDN (CDM dose: 1.35 mg/kg, intravenous administration weekly, 7 doses in total). (mean ± s.e.m., n=5 independent animals for blood test, n=3 independent animals for liver panel test). (b) Representative haematoxylin and eosin (H&E) staining of normal tissue slice from mice treated with saline or treatment strategy shown in Figure 6a for CDN (scale bar: 50 μm). Slides from 5 independent animals were imaged and showed similar results.
