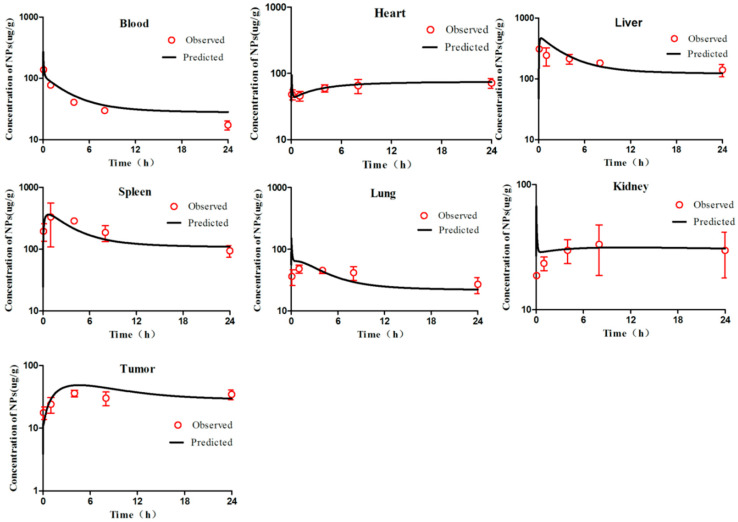
Figure 2.
Simulated and experimentally measured concentration–time curves of mPEG5k-9.09%-80 nm NPs in murine blood and tissues after intravenous injection. Simulation results are represented by solid lines in each panel, and the mean values of measured data are represented by red dots. Error bars represent standard deviation of experimentally measured data.

