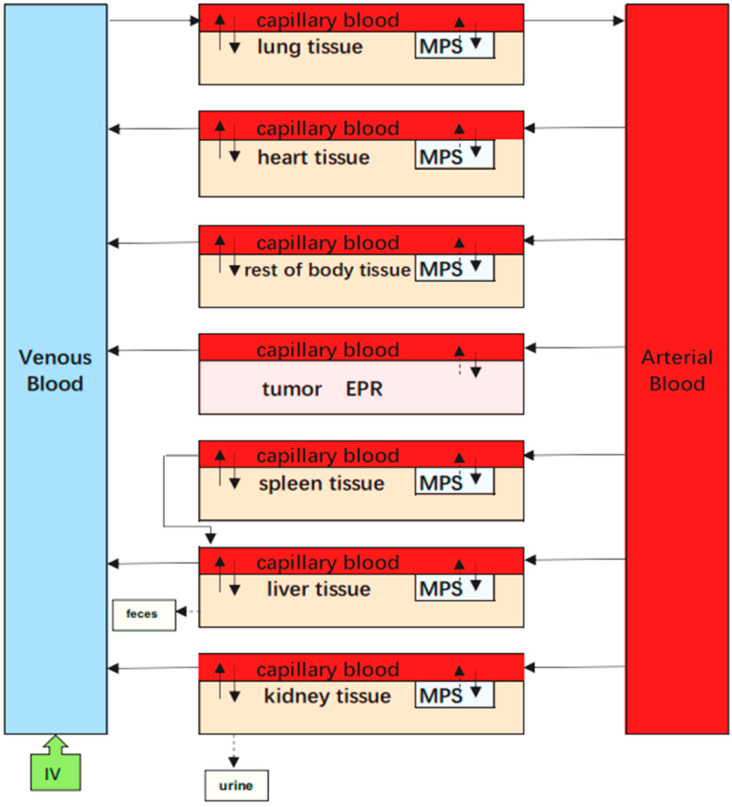
Figure 19.
Schematic diagrams illustrating the PBPK model for mPEG-PCL NPs, including mononuclear phagocytic system in organs represented as “MPS” and enhanced permeability and retention in tumours represented as “EPR.” Arrows indicate the direction of transport of mPEG-PCL NPs, while grey boxes indicate the uptake of mPEG-PCL NPs by MPS or EPR from blood circulation or tissues.

