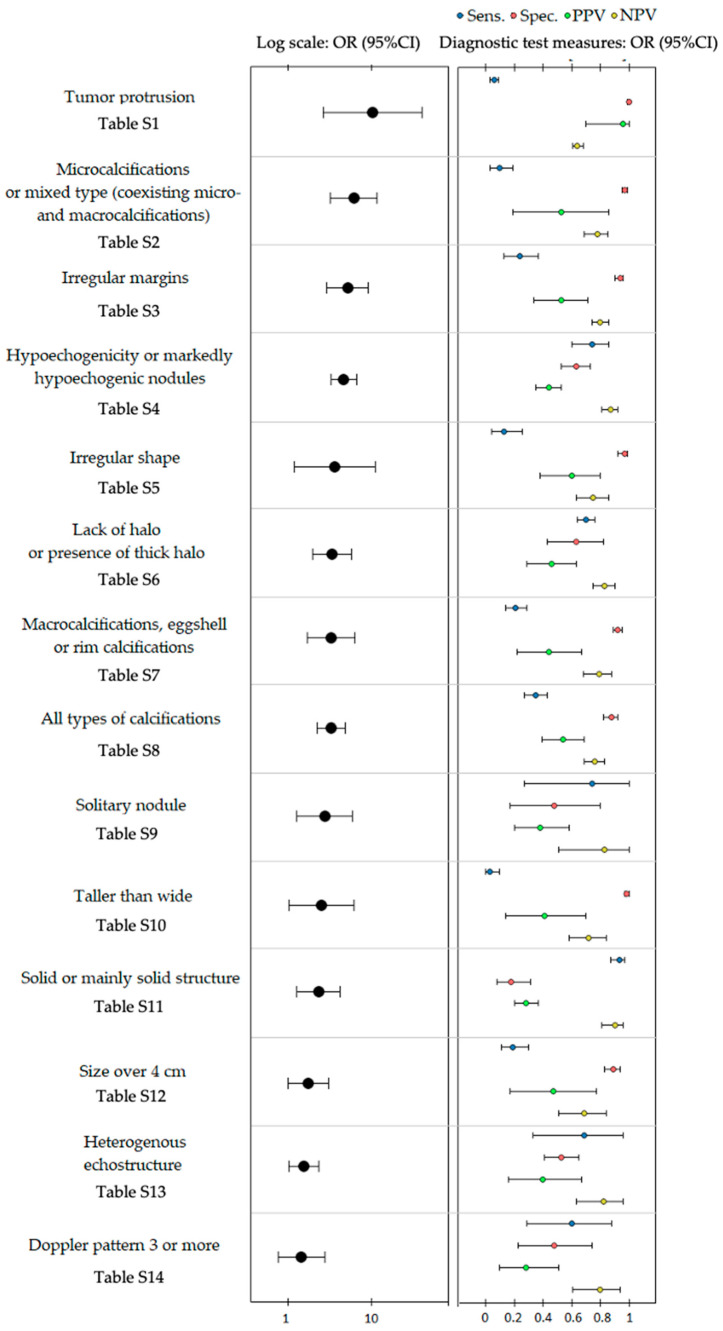
Figure 2.
The graphic presentation of overall specificity, sensitivity, negative prognostic value (NPV), and positive predictive value (PPV) for sonographic features differentiating follicular thyroid cancer from follicular adenoma utility and their overall odds ratios (OR) with their 95% confidence intervals (95% CI).

