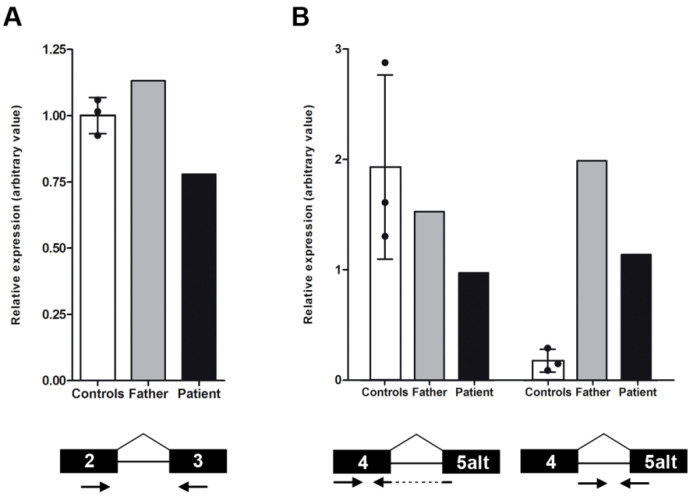
Figure 3.
Study of the nicotinamide mononucleotide adenylyltransferase 1 (NMNAT1) expression levels by real-time reverse transcriptase (RT)-PCR was performed in the patient and her father, and compared with those of three healthy control subjects. The first graph (A) shows slightly higher levels of total NMNAT1 mRNA in the father and lower levels in the patient. The second graph (B) represents the level of two concrete NMNAT1 transcript variants: the alternative isoform (transcript variant NM_001297779.1, left bars) and a newly identified isoform with the intron 4 retention (right bars). Only the patient showed decreased expression of the alternative isoform, whereas both tested family members presented dramatically higher levels of expression of the new isoform. In all cases, control error bars correspond to the standard deviation between the three biological replicates. The concrete amplicon localization is shown under the graph in each condition. Arrows represent forward and reverse primers, whereas the black boxes are the concrete target exons.

