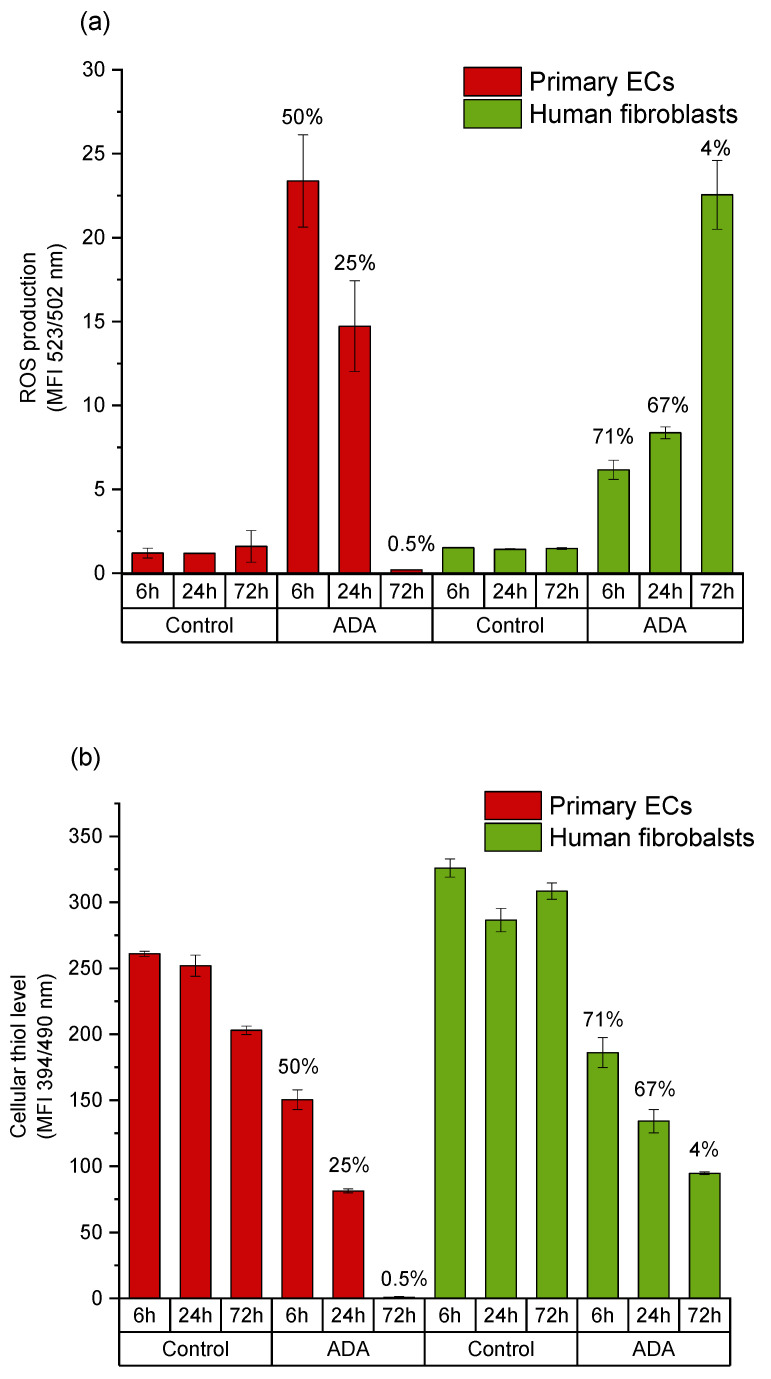
Figure 6.
Comparison of intracellular reactive oxygen species (ROS) levels and cellular thiol levels in primary ECs and fibroblasts grown in a time dependent manner in ADA. (a) Mean value of DCF emission detected by flow cytometer; (b) intracellular thiol level of cells under the same conditions. Results obtained in the same cell population with MBB staining and mean value of emission are presented. Cell viability at respective time points is indicated above the columns. Control: cells with DCFH-DA grown on cell culture plastic.

