
Figure 5.
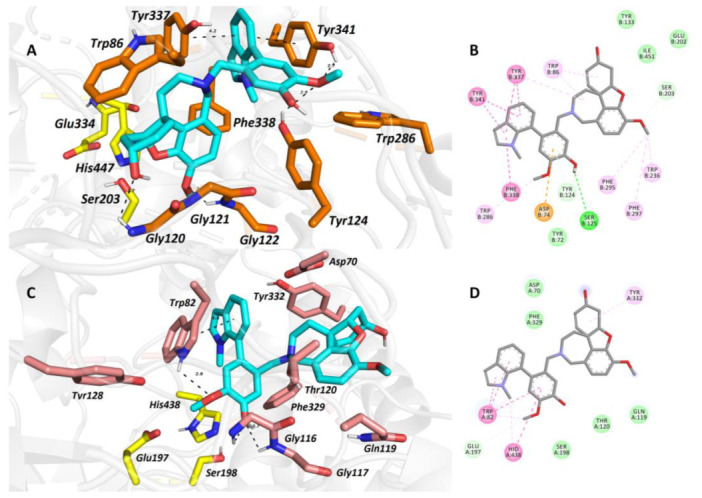
The top-scored docking poses of 2 in the hAChE (A,B; PDB ID: 4EY6) and hBuChE (C,D; PDB ID: 4BDS) active sites. Spatial orientation for each ligand is presented as three-dimensional (A,C) and two-dimensional (B,D) diagrams, respectively. The ligand is displayed in light blue (A,C); important amino-acid residues responsible for ligand anchoring are shown in orange for hAChE and salmon for hBuChE. Catalytic triad residues are displayed in yellow (A,C). Important interactions are rendered with black dashed lines; distances are measured in angstroms (Å). The rest of the receptor is displayed in light-gray cartoon conformation (A,C). Panels (A) and (C) were created with the PyMOL Molecular Graphics System, Version 2.4.1, Schrödinger, LLC. Two-dimensional (2D) diagrams (B,D) were created with Dassault Systèmes 2016, BIOVIA, Discovery Studio Visualizer, v 17.2.0.16349, San Diego, CA, USA.