Figure 2.
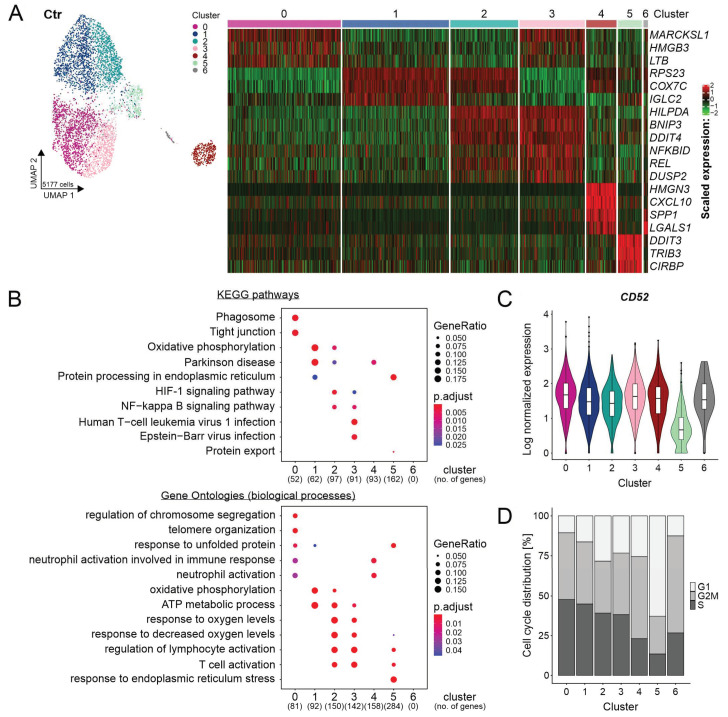
Heterogeneity of REC-1 cell line on the single-cell level. (A) Uniform manifold approximation and projection (UMAP) representation visualizing 7 clusters at resolution 0.4 in the integrated and cell cycle regressed data set of untreated cells (Ctr) and the corresponding heatmap showing selected top 10 marker genes (see Table S2 for cluster markers); (B) gene set enrichment analysis for Kyoto Encyclopedia of Genes and Genomes (KEGG) pathways and gene ontologies (biological processes) including genes of Ctr with a log fold change > 0.1 and adjusted p-value < 0.001 (no. = number); no matches were detected for cluster 6 due to few differentially expressed genes (DEGs); (C) violin plot of CD52 expression in Ctr (clustering is shown in (A); and (D) bar plot showing the proportions of predicted cell cycle phases (G1, G2/M, or S) across clusters of Ctr by Seurat’s cell cycle scoring.

