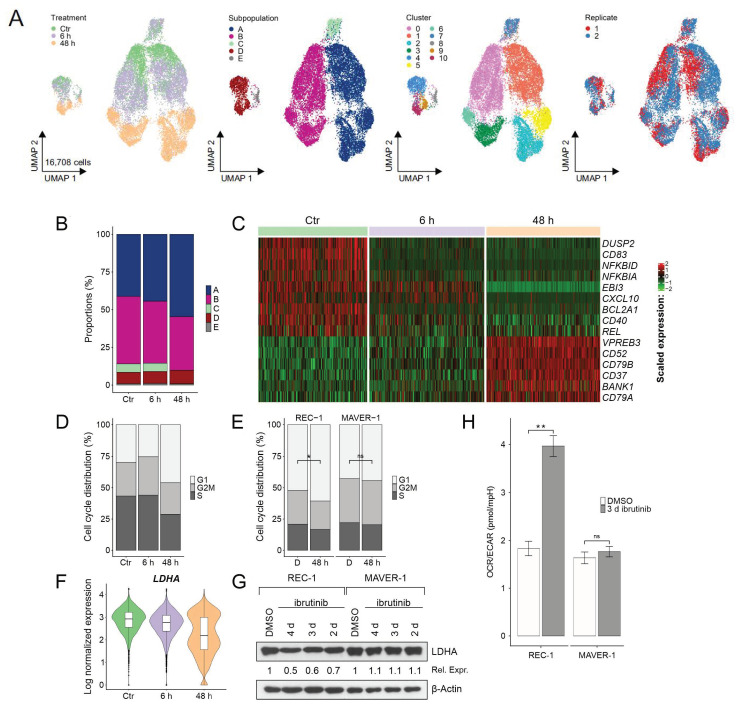
Figure 3.
Evolution of subpopulations across ibrutinib treatment. (A) Uniform manifold approximation and projection (UMAP) representations of the combined data set including replicate 1 and 2 of Ctr, 6 h, and 48 h after cell cycle regression (clusters are shown for resolution 0.4 with additional subclustering of subpopulation D at resolution 0.3); (B) proportions of subpopulations across treatment; (C) heatmap of selected marker genes of Ctr, 6 h, and 48 h (see Table S3 for treatment markers); (D) distribution of predicted cell cycle phases (G1, G2/M, and S) across treatment by Seurat’s cell cycle scoring; (E) distribution of cell cycle phases acquired by flow cytometry (sensitive REC-1 compared to resistant MAVER-1 cell line, D = DMSO control, 48 h = 48 h 400 nM ibrutinib treatment; n = 3, * p ≤ 0.05, ns = not significant); (F) violin plot of LDHA expression levels of the single-cell sequencing data; (G) Western blot of LDHA expression after ibrutinib treatment (DMSO as control, 400 nM ibrutinib for 2 d, 3 d, and 4 d) in sensitive REC-1 and in resistant MAVER-1, β-actin served as loading control, relative expression (Rel. Expr.) to DMSO control was calculated after normalization to β-actin (Western blot and relative expression values are shown representative for three independent replicates); and (H) extracellular flux analysis of 3 d ibrutinib (400 nM) or DMSO (control) treated cells (sensitive REC-1 compared to resistant MAVER-1) by Agilent Seahorse XF 96 Analyzer; the ratio of oxygen consumption rate (OCR) to extracellular acidification rate (ECAR) is shown (n = 3, ** p ≤ 0.005, ns = not significant).

