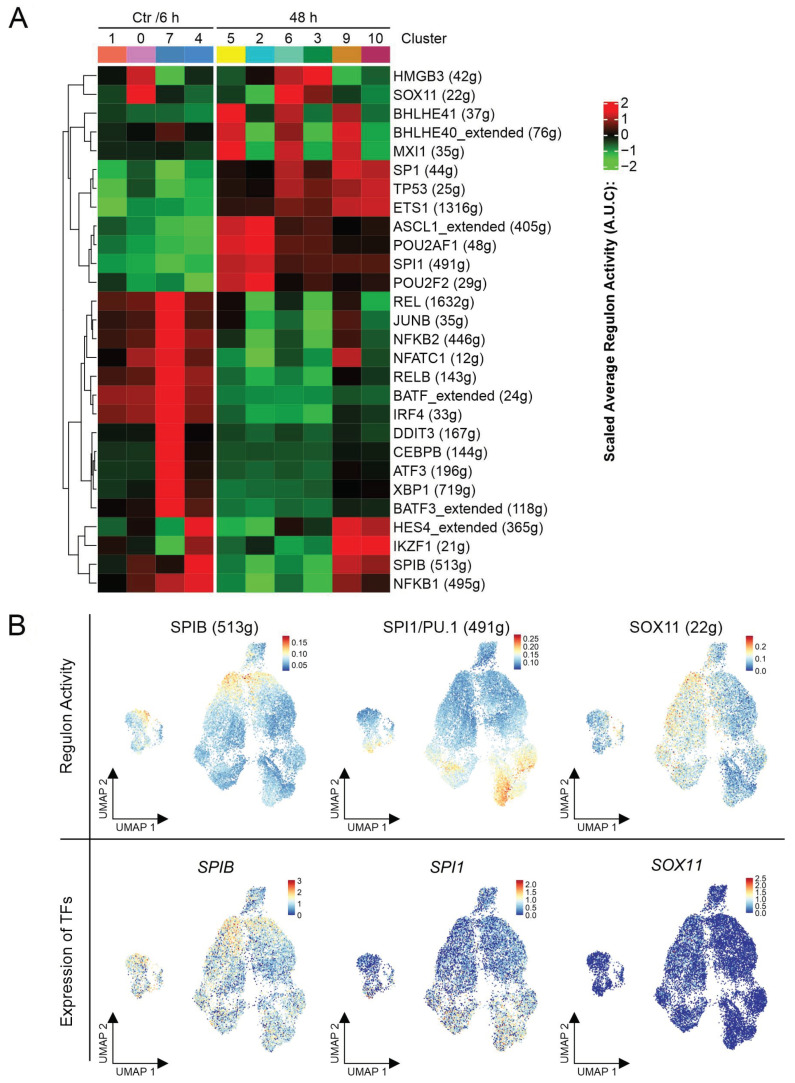
Figure 4.
Altered gene regulatory networks during ibrutinib treatment. (A) Heatmap representing the alterations in gene regulatory networks in the eleven clusters of the combined analysis (Ctr, 6 h, and 48 h) (clustering is shown in Figure 3A), numbers in brackets indicate the amount of genes forming the gene regulatory networks of the indicated transcription factor and (B) uniform manifold approximation and projection (UMAP) representations in the first row show the regulon activity of the indicated transcription factors, UMAPs underneath display the gene expression (log normalized) of the transcription factors.

