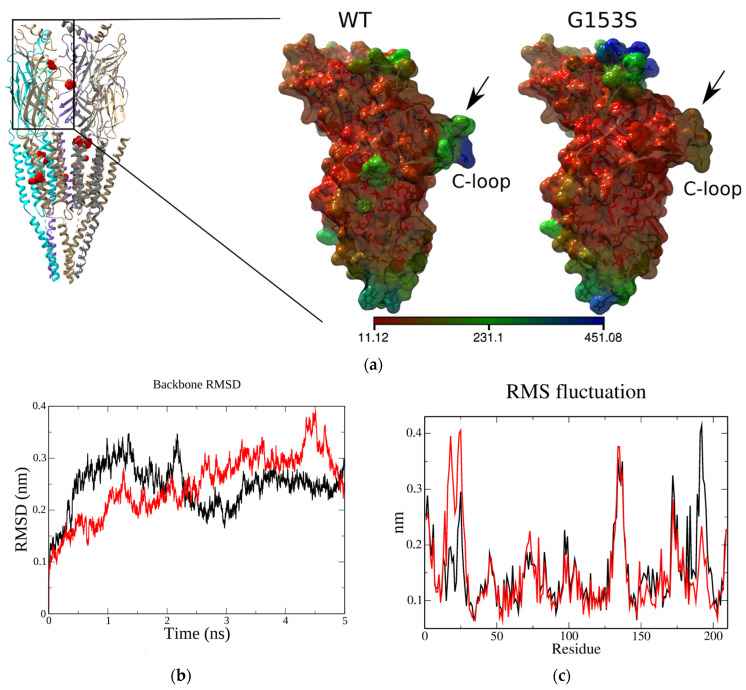
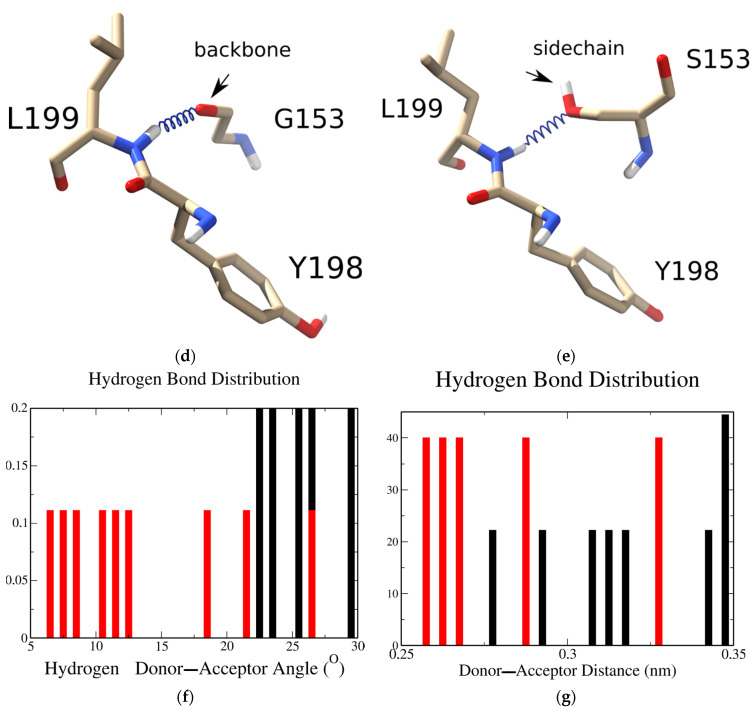
Figure 1.
Molecular modeling of the wild type (WT) and G153S mutant Torpedo α1 nAChR: (a) overall side view of muscle nAChR with amino acid residues, where mutations that are associated with slow-channel myasthenia are shown in red. Note that only one mutation is situated in the extracellular domain of the α1 subunit (the other is situated in the complementary subunit). Atomic coordinates of the extracellular domain of the α1 nAChR subunit have been copied from the PDB 6UWZ and either subjected to molecular dynamics without changing, or after changing of G153 residue to serine. Both molecules underwent 5 ns unconstrained molecular dynamics. The flexibility of amino acid residues side chains of G153S mutant showed moderate differences from the WT. Molecular surfaces are colored according to residue flexibility: the most flexible residues are shown in blue, less flexible are in red (residues of intermediate flexibility are depicted green). Note that the C-loop residues are more rigid in G153S mutant; (b) extracellular domains of WT (black) and G153S mutant (red) of α1 nAChR are relatively stable during 5 ns molecular dynamics showing root mean square deviation (RMSD) variability of the backbone in range 0.1–0.2 nm; (c) root mean square fluctuations of amino acid residues α-carbons of WT (black) and G153S mutant (red) of α1 nAChR extracellular domains during 5 ns molecular dynamics. N-terminal (10-25) and C-loop (180–200) regions show most prominent difference; (d) in the WT receptor the backbone oxygen of G153 is able to form a hydrogen bond with the backbone of L199 residing in the C-loop; (e) in the G153S mutant this hydrogen bond switches from the backbone oxygen to the side chain oxygen of serine, which changes the properties of the receptor and lead is to the SCCMS manifestation; (f) hydrogen bond angles distribution between the G153 and L199 in the WT receptor (red) compared to the G153S mutant (black); and (g) hydrogen bond distances distribution between the G153 and L199 in the WT receptor (red) compared to the G153S mutant (black).


