Figure 5.
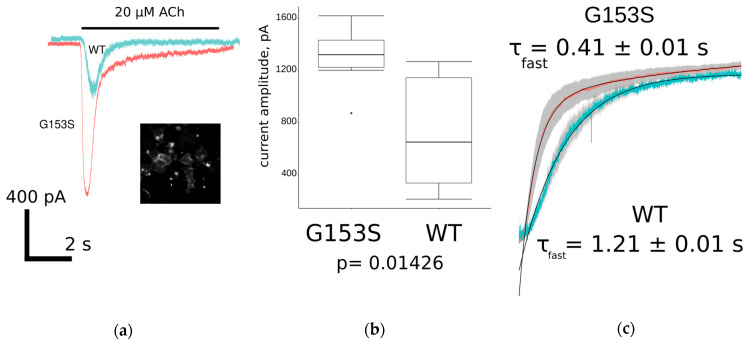
Patch-clamp electrophysiology study of WT and G153S muscle nAChR overexpressed in neuro 2a cells: (a) comparison of ionic current trace shapes of WT (light blue) and G153S (pink). Inset shows specific membrane staining with selective muscle nAChR ligand Alexa Fluor 555 α-bungarotoxin; (b) comparison of the maximal achieved acetylcholine-evoked current amplitudes for G153S and WT muscle nAChRs represented as a box-and-whisker plot. Mean amplitude of G153S mutant is slightly higher than amplitude of WT receptor at significance level p < 0.05 (two-sample t-test, n = 8); and (c) averaged (n = 8) current decay of G153S (pink) and WT (light blue) fitted with double exponential curves. Standard errors of the mean values in each time point are shown as gray shadows under the curves. Time constants of fast exponential component differ about three-fold.

