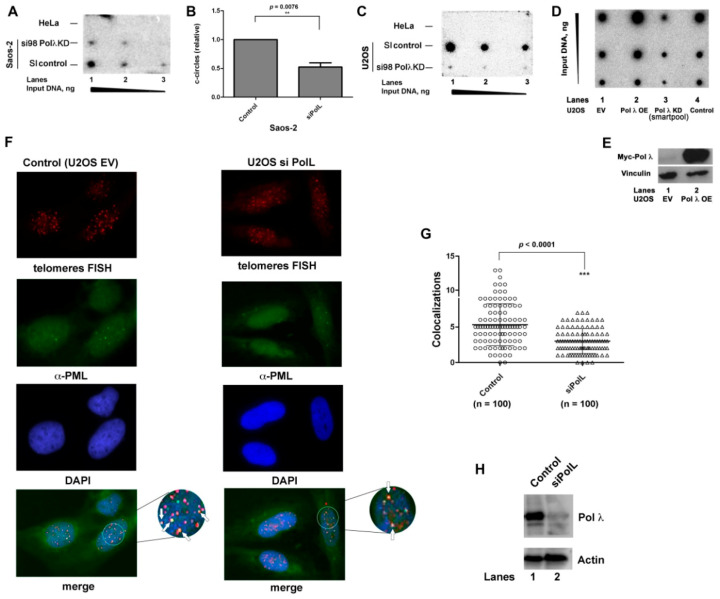
Figure 2.
The levels of DNA polymerase λ correlate with the cellular ALT activity. (A) Dot blot assay for c-circle formation. Different amounts of amplified c-circle DNA from HeLa (top lane) or Saos-2 cells, either silenced for Pol λ (mid lane) or treated with scrambled control (bottom lane), were spotted on a membrane and hybridized with a radioactive telomeric probe. (B) Quantification of c-circles in SI control vs. Pol λ KD Saos-2 cells. Values are the mean of three independent experiments, each comprising three different amounts of DNA as in panel A. Error bars are ± S.D. The χ2 p value is shown on top. **, χ2 p value < 0.01. (C) As in panel A, but with c-circle DNA amplified from HeLa cells (top lane) or U2OS cells, either silenced for Pol λ (bottom lane) or treated with scrambled control (mid lane). (D) Dot blot assay for c-circle formation. Different amounts of amplified c-circle DNA from U2OS cells transfected with the empty vector (EV, lane 1), U2OS cells overexpressing Pol λ (OE, lane 2), U2OS cells silenced for Pol λ (KD, lane 3) or untreated U2OS cells (Control, lane 4), were spotted on a membrane and hybridized with a radioactive telomeric probe. (E) Western Blot analysis showing the levels of Pol λ in U2OS cells transfected with the Pol λ expression vector (corresponding to Pol λ OE of panel C). EV, U2OS cells transfected with the empty vector as negative control. (F) Confocal microscopy imaging of colocalization of PML protein (green) and telomeres (red) in U2OS cells either silenced for Pol λ (right panels) or control (left panels). Nuclei were stained with DAPI (blue). Representative colocalization events are indicated by white arrows. (G) Statistical analysis of three independent experiments comparing the number of colocalization events in control and silenced cells (n. of cells = 100 for each condition). The number of colocalization events observed within a single cell is shown for control (circles) and silenced (triangles) cells. χ2 p value is shown on top (***, χ2 p value < 0.0001). (H) Western Blot analysis showing the levels of Pol λ in U2OS cells either transfected with scramble control siRNA (lane 1) or anti-Pol λ siRNA (lane 2).

