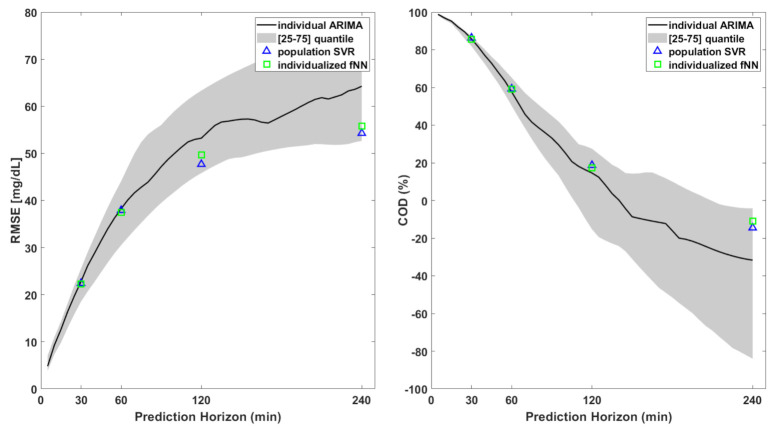
Figure 6.
RMSE (left) and COD (right) for the 3 best-performing algorithms out of the 30 tested in this work. The black lines are the median RMSE and COD (left and right, respectively) obtained using individual ARIMA with different prediction horizons. Blue triangles and green squares indicate the same metrics for PH = 30, 60, 120, and 240 min for population SVR and individualized fNN, respectively.

