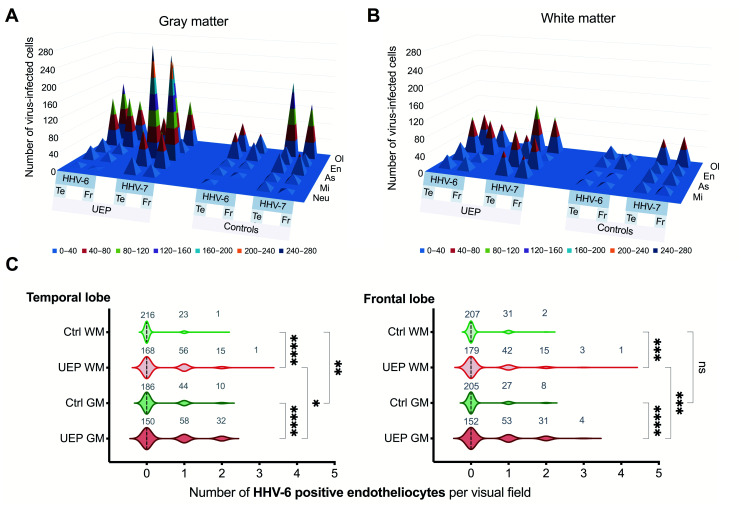
Figure 2.
Pyramidal 3D surface and violin plots representing the data of brain tissue immunohistochemical (IHC) analysis: (A) total numbers of herpesvirus-6, -7 (HHV-6, -7) positive Neu (neurons), As (astrocytes), Ol (oligodendrocytes), Mi (microglia), En (endotheliocytes) in the gray matter of the unspecified encephalopathy (UEP) group and controls, frontal lobe (FR), temporal lobe (Te); (B) total numbers of HHV-6, -7 positive As (astrocytes), Ol (oligodendrocytes), Mi (microglia), En (endotheliocytes) in the white matter of the UEP group and controls, frontal lobe (FR), temporal lobe (Te); (C) distribution of total HHV-6 immunopositive endothelial cells per visual fields in the white (WM) and gray matter (GM) of the control (Ctrl) and UEP group in the temporal and frontal lobe. The blue plane represents a zero level (no virus-infected cells in the visual fields). Violin plots: dashed lines represent the approximate ratio of visual fields (out of 240) with HHV-6 positive endotheliocytes to fields with HHV negative cells (“0”— ratio less than 1.0, “1”— more than 1.0); numbers in gray show visual fields; asterisks represent a significance level (* p < 0.05, ** p < 0.01, *** p < 0.001, **** p < 0.0001) between group differences (Kruskal-Wallis test ).

