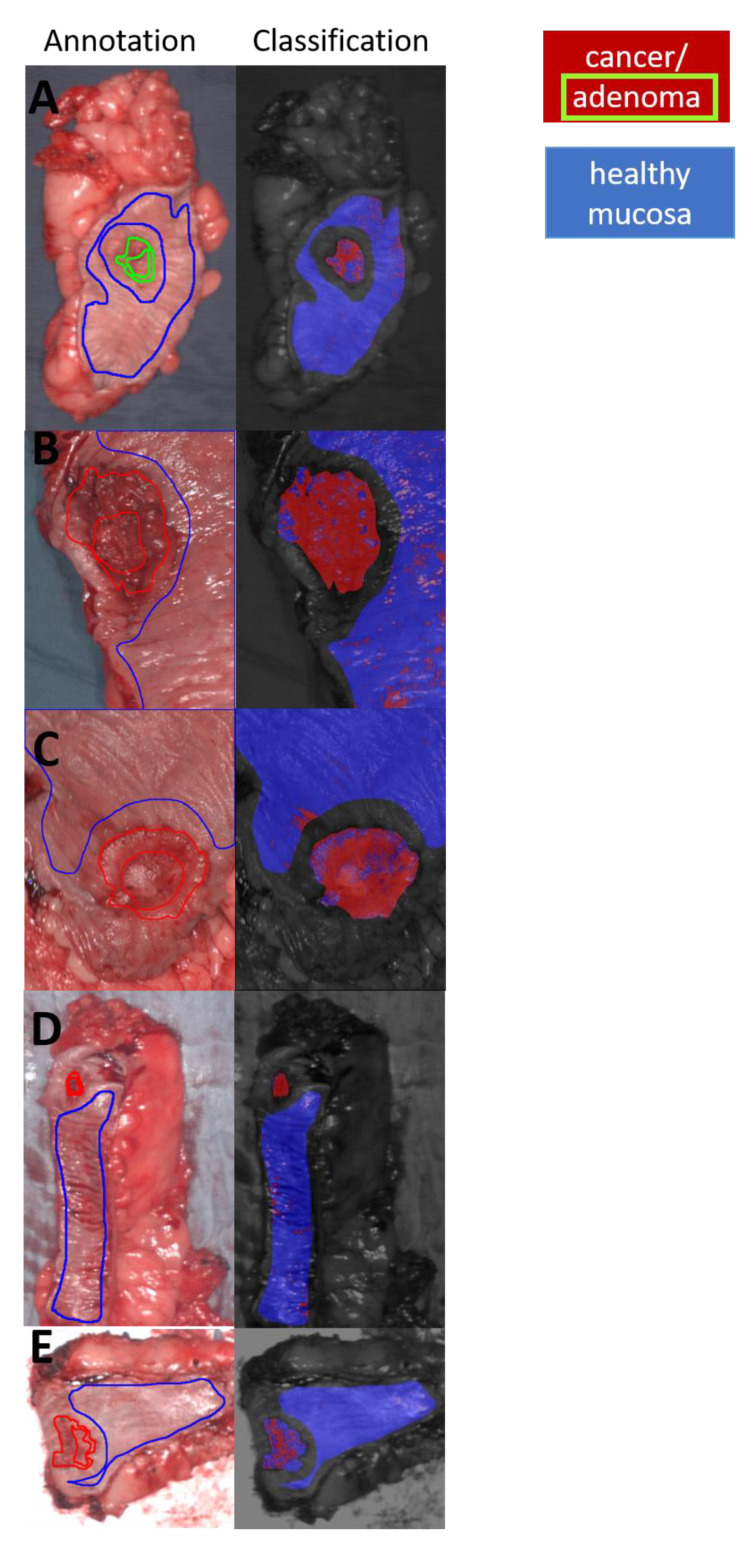
Figure 3.
(A,C,E,G) represent annotation and classification of cancerous tissue: A = adenoma; B = ypT2 pN1a (1/23) pM1a (PUL) L1 V0 Pn0, UICC Stage IV A; C = pT2 pN0 (0/18) M0 L0 V0 Pn0, UICC Stage I; D = pT3a pN0 (0/29) M0 L1 V0 Pn0, UICC Stage IIA; E = ypT3 ypN1b (2/21) M0 L1 V0 Pn0, UICC Stage yp III A. (red fill: cancer and adenoma, red line: cancer, green line: adenoma, blue fill: healthy mucosa, blue line: healthy mucosa).

