Figure 1.
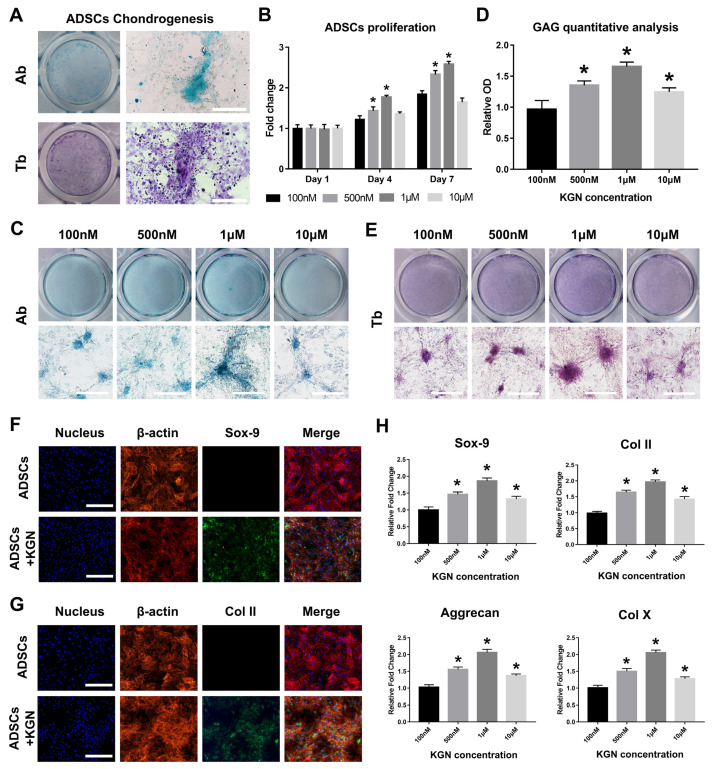
The chondrogenic differentiation of adipose derived mesenchymal stem cells (ADSCs) induced by kartogenin (KGN). (A) The verification of ADSCs chondrogenesis by transforming growth factor β3 (TGFβ3) and the Ab and Tb stainings showed the successful chondrogenic differentiation, Bar: 200 μm. (B) the Cell Counting Kit-8 (CCK8) analysis of the ADSCs proliferation treated with different KGN concentrations. * p < 0.05 indicates a significant difference compared to the corresponding 100 nM group at each time point. (C) The evaluation of different KGN concentrations on ADSC chondrogenic differentiation. The Ab stainings were used to test the effects of different KGN concentrations (100 nM, 500 nM, 1 μM and 10 μM), bar: 200 μm. (D) The quantitative analysis of the alcian blue staining to evaluate the glycosaminoglycan (GAG) content. * p < 0.05 indicates a significant difference compared to the 100 nM group. (E) The evaluation of different KGN concentrations on ADSCs chondrogenic differentiation. The Tb stainings were used to test the effects of different KGN concentrations (100 nM, 500 nM, 1 μM and 10 μM), bar: 200 μm. Immunofluorescence staining of the chondrogenic markers Sox-9 (F) and Col II (G) to clarify the ADSCs chondrogenesis, Bar: 200 μm. (H) Real-time PCR quantitative analysis of the chondrogenic markers including Sox-9, Col II, Aggrecan and Col X. * p < 0.05 indicates a significant difference compared to the 100 nM group.

