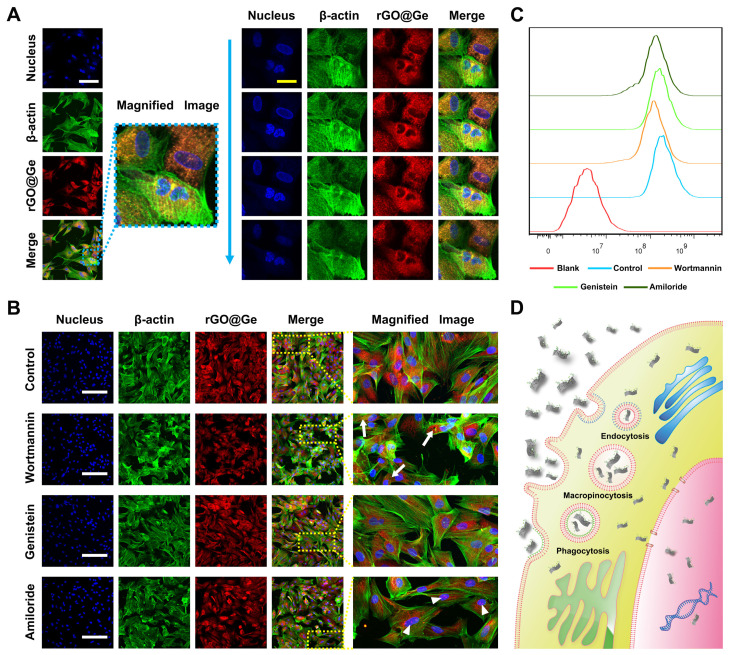
Figure 4.
The entry pathway of rGO@Ge in ADSCs. (A) The Rhodamine 6G (R6G)-labeled rGO@Ge was taken up by ADSCs and it was located in the cytoplasm and nucleus; the right part shows the different images via the vertical Z axis, white bar: 100 μm, yellow bar: 25 μm. (B) The changes of the rGO@Ge taken up by ADSCs that were pretreated with different inhibitors. The arrow indicates the vacuole due to the blocky of the phagocytosis by wortmannin, and the arrowhead indicates the accumulation of rGO@Ge in the nucleus due to the inhibition of macropinocytosis by amiloride, bar: 200 μm. (C) The flow cytometry analysis on the quantity variance of the R6G-labeled rGO@Ge that were taken up by ADSCs between the different inhibitor-pretreated groups. (D) Schematic diagram illustrating the pathway of rGO@Ge entering ADSCs and its distributions in cell.

