Figure 8.
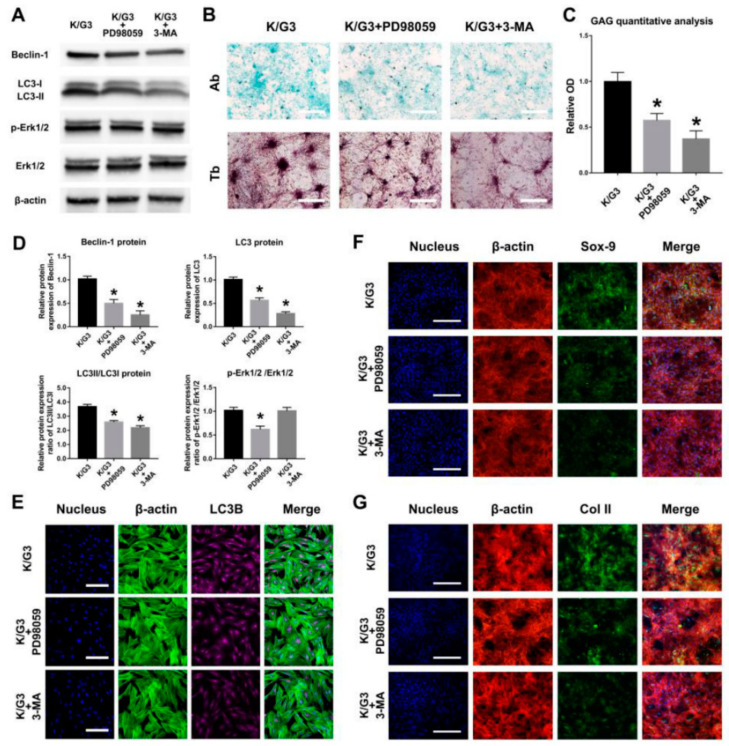
The correlation between the autophagy and chondrogenesis induced by rGO@Ge in ADSCs cultured with K/G3 medium. (A) The Western blot analysis on the Erk1/2 signal pathway and autophagy associated proteins in ADSCs co-cultured with PD98059 or 3-MA in K/G3 medium. (B) The Ab and Tb stainings of the ADSCs chondrogenesis treated with K/G3, K/G3+PD98059 and K/G3+3-MA medium, bar: 500 μm. (C) The quantitative analysis of the alcian blue staining to evaluate the GAG content. * p < 0.05 indicates a significant difference compared to the K/G3 group. (D) The quantitative analysis of the Beclin-1, LC3, LC3II/LC3I, p-Erk1/2 /Erk1/2. * p < 0.05 indicates a significant difference compared to the K/G3 group. (E) The LC3B immunofluorescent staining was used to test the autophagic activities, bar: 200 μm. Immunofluorescence staining of the chondrogenic markers Sox-9 (F) and Col II (G) clarified the difference of ADSCs chondrogenesis in three groups, Bar: 200 μm.

