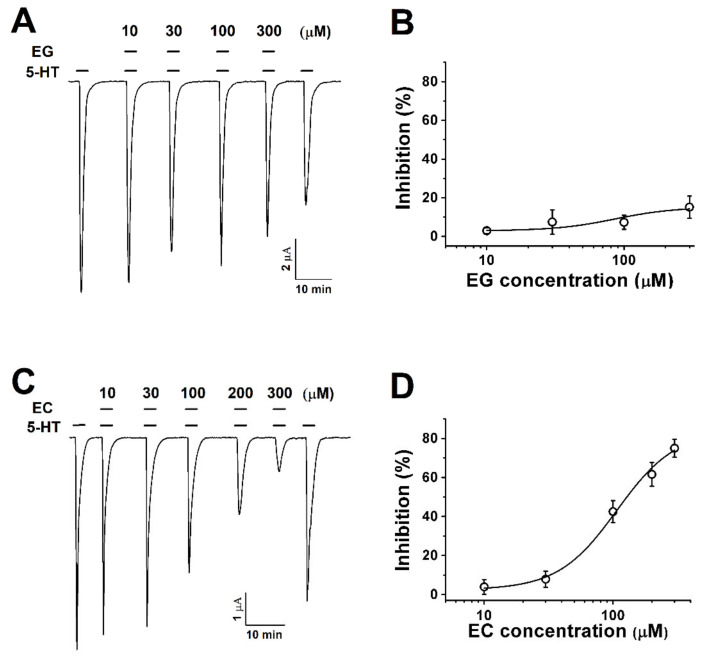
Figure 2.
The concentration-dependent response of Xenopus oocytes expressing human 5-HT3A receptors to ergot alkaloids. (A). The traces represent increases in the current inhibition with increases in the ergonovine concentration. Treatment with 5-HT (100 µM) alone induced an inward current followed by various response traces with 5-HT (100 µM) and ergonovine (10, 30, 100, and 300 µM). (B). The plot shows the ergonovine inhibition current fitted according to Hill’s equation, where the maximum inhibition (Imax) was 15 ± 5.7%. (C). The traces induced by chanoclavine with 5-HT (100 µM) appear dependent upon the concentration (10, 30, 100, and 300 µM). (D). Average percentage curves of chanoclavine fitted according to Hill’s equation based on the peak of the inward current. The Imax was 83.6 ± 12.6%, and the inhibition was 4 ± 3.8%, 7.9 ± 4.1%, 42.5 ± 5.7%, 61.6 ± 6.1%, and 75 ± 4.5% at 10, 30, 100, 200, and 300 µM, respectively. The oocytes expressing human 5-HT3A mRNA were held at −80 mV, and each value represents the mean ± SEM (n = 8–10 from four different frogs).

