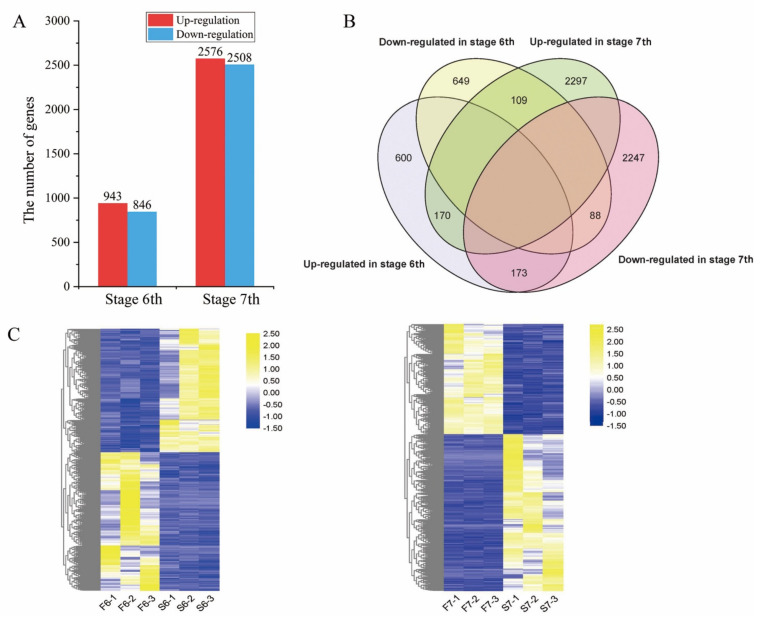
Figure 5.
Differentially expressed genes (DEGs) in PA64S(S) and PA64S(F). (A) The number of genes upregulated or downregulated in response to temperature by > 1-fold in stages 6 and 7 (p < 0.05). (B) Venn diagram showing the unique and shared DEGs in stages 6 and 7. (C) Hierarchical cluster analysis of DEGs in stages 6 and 7.

