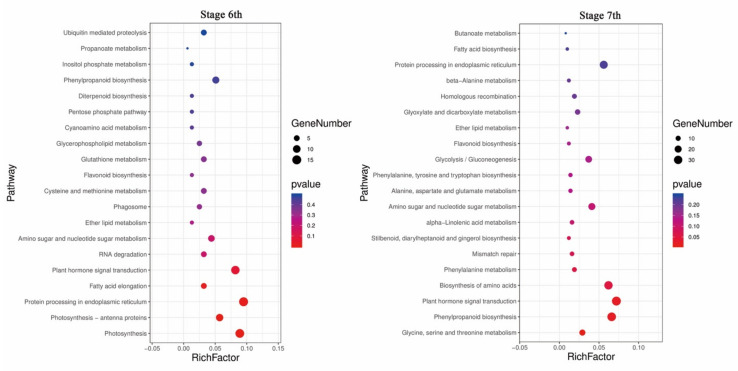
Figure 7.
Kyoto Encyclopedia of Genes and Genomes (KEGG) enrichment analysis of DEGs in stages 6 and 7. The top 20 enriched pathways in stages 6 and 7 are shown. Each circle represents a KEGG pathway. The X-axis represents the enrichment factor, which compares the ratio of genes annotated to a pathway among the DEGs to the ratio of genes annotated to that pathway among all genes, and the Y-axis represents the pathway name.

