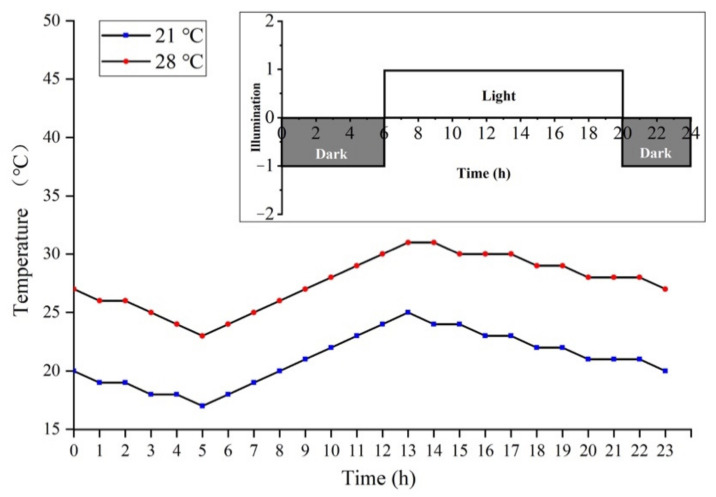
Figure 12.
Temperature setting conditions for the low- and high-temperature treatment of PA64S. The red line represents the high-temperature treatment, and the blue line represents the low-temperature treatment. In the light intensity diagram, dark rectangles represent darkness, and light rectangles represent lights.

