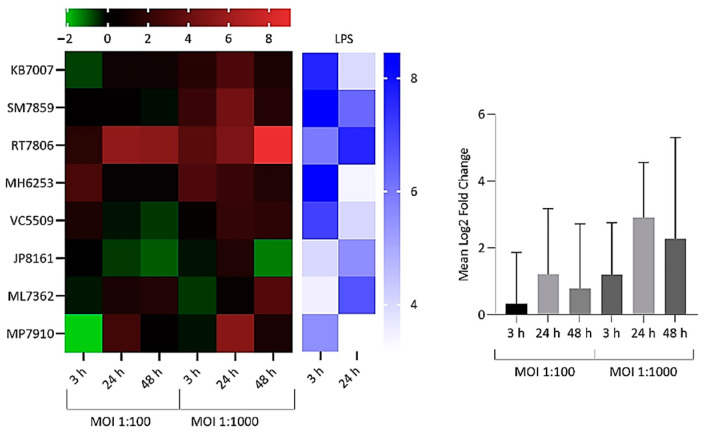
Figure 2.
Heatmap and bar chart of log2 fold gene expression changes for interleukin (IL)-1β in NP-derived disc cells infected with C. acnes. Heatmap values are individual expression changes (3 × biological replicates) from eight donor samples, while the bar chart represents average donor changes. Results with lipopolysaccharide (LPS)-positive controls are also shown. The top bar represents the log2 fold-change scale.

