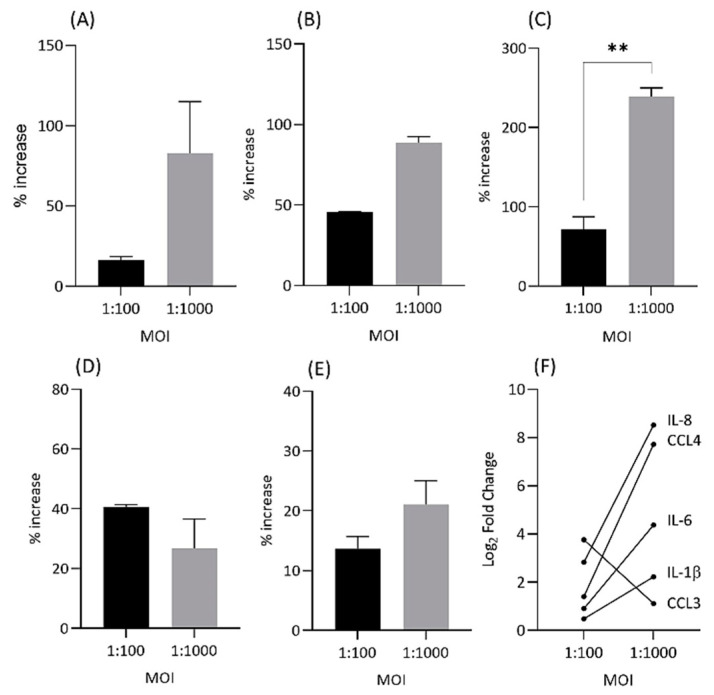
Figure 6.
Percentage increase in protein expression (ng/mL) for IL-1β (A), IL-6 (B), IL-8 (C), CCL3 (D) and CCL4 (E) at 24 h and MOIs = 1:100 and 1:1000 for infected vs. control NP cells. Changes in gene expression levels between MOIs for cytokines and chemokines by qPCR (F). Cell lysates from donor MH6352 cells only were assayed in duplicate for IL-1β, IL-6, IL-8 and CCL3, while ML7362 was used for CCL4. ** p < 0.01.

