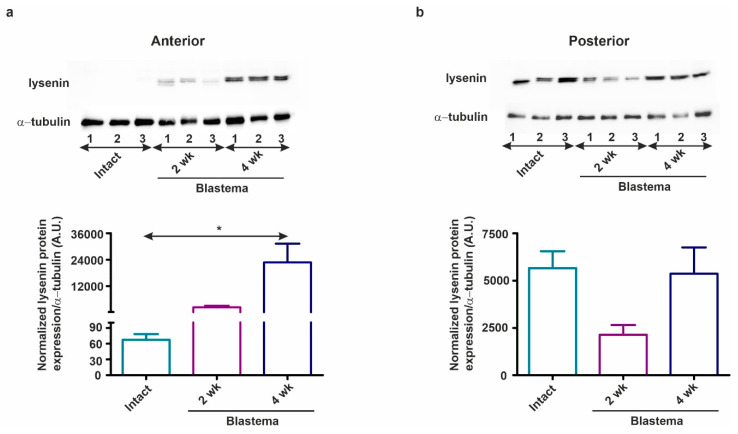
Figure 10.
The protein profile of lysenins was studied by Western-blot during (a) anterior and (b) posterior restoration in intact earthworms and in 2 and 4 weeks regenerating blastema. Upper bands supposedly correspond to lysenin-related protein 2 (~40 kDa) and lower bands to lysenin (~37–38 kDa). Three independent experiments are presented (n = 3). The graphs below indicate the band intensity normalized to the corresponding protein band of α-tubulin as reference protein. The values illustrate mean ± SEM.

