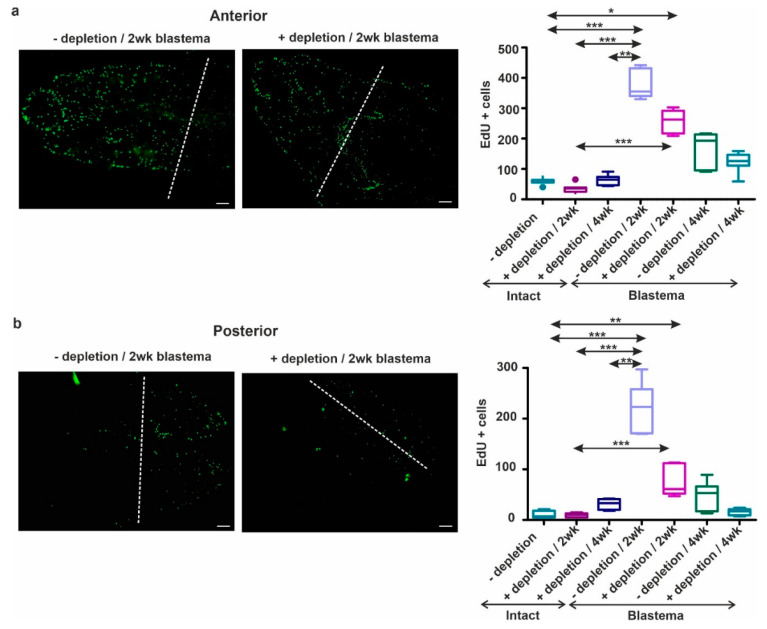
Figure 11.
Detection of cell proliferation in the 2-week (a) anterior or (b) posterior blastema without (left side) or after coelomocyte depletion (right side). Representative images were selected from seven independent experiments of 2-week regenerating earthworms. The level of amputation is indicated by a dashed line. Proliferating cells (green) were enumerated and illustrated on the graphs adjacent to EdU-stained images. Intact earthworms (-) without or (+) with coelomocyte depletion for corresponding intervals used as controls. The amount of proliferating cells (-) without or (+) with coelomocyte ablation, after 2 and 4 weeks, was assessed in the regenerative blastema. Results are depicted on the same graph next to the counted cells of intact segments. The boxes mean interquartile ranges (IQR), whiskers represent lowest and highest values, horizontal lines label median of seven independent (n = 7) repetitions. The significance of the data was interpreted by one-way ANOVA with Dunnett’s post-hoc test with GraphPad Prism software (* p < 0.05, ** p < 0.01, *** p < 0.01). Scale bars: 200 μm.

