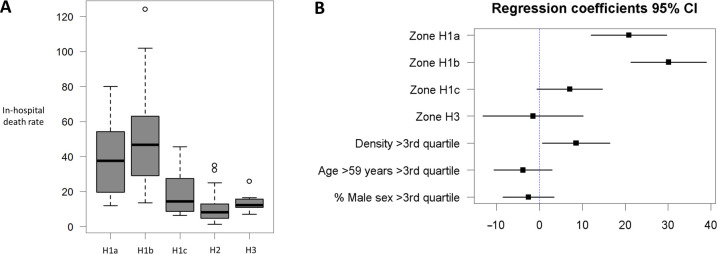
Figure 2.
(A) Boxplots of in-hospital mortality rates according to the main climate zones. The internal bold horizontal line is the median; the lower and upper box limits are the first and third quartile, respectively; and the T-bars represent range. (B) Multivariate linear-regression analysis (95% CIs; with H2 serving as the reference). The analysis retained climate zones (H1a, H1b) and population density as independent factors significantly influencing in-hospital mortality.

