Figure 1.
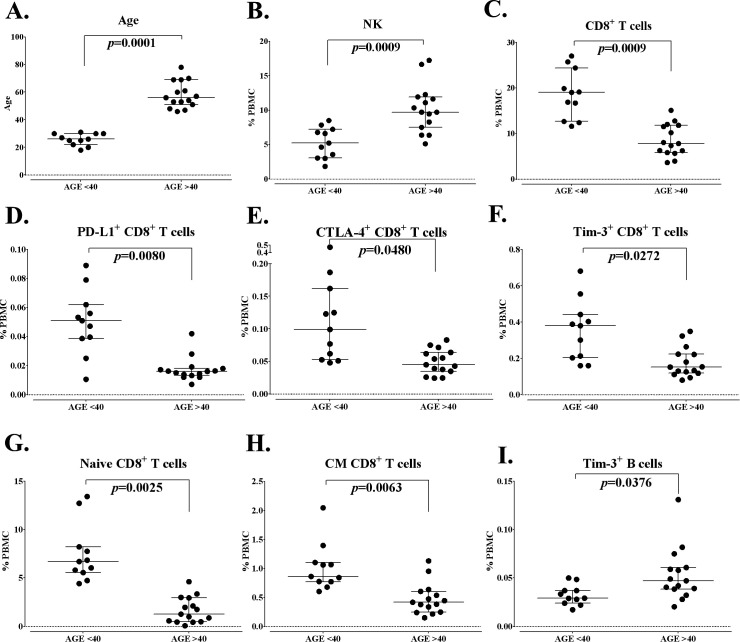
Differences in standard parental immune cell types and refined subsets in healthy donors under and over the age of 40. (A) Healthy donors included in this analysis were separated as younger (age less than 40 years, n=11) and older (age greater than 40 years, n=15). (B, C) Standard parental immune cell types that were different between healthy donors under and over age 40. (D–I) Representative graphs are shown for notable refined subsets related to activation and maturation, with differences between healthy donors under and over the age of 40 indicated. Graphs display median frequency as a percentage of PBMCs with 25–75 percentiles. Differences were defined by an adjusted p<0.05, the median of groups showing a >50% difference, and a frequency above 0.01% of PBMCs. P value was calculated using the Mann-Whitney test and with Holm adjustment made for multiple comparisons using the number of standard immune cell types with a frequency above 0.01% of PBMCs (n=9). For refined subsets, Holm adjustment was made using the number of subsets within each standard subset with a frequency above 0.01% of PBMCs (n=29 for CD4+ T cells, 25 for CD8+ T cells, 5 for regulatory T cells (Tregs), 14 for NK cells, 3 for NKT cells, 4 for B cells, 2 for conventional dendritic cells (cDCs), 3 for plasmacytoid DCs (pDCs) and 15 for MDSCs). Figure adapted from Lepone.18 CTLA-4, cytotoxic T lymphocyte-associated protein-4; MDSCs, myeloid-derived suppressor cells; NK, natural killer; PBMCs, peripheral blood mononuclear cells; PD-L1, programmed cell death ligand-1.

