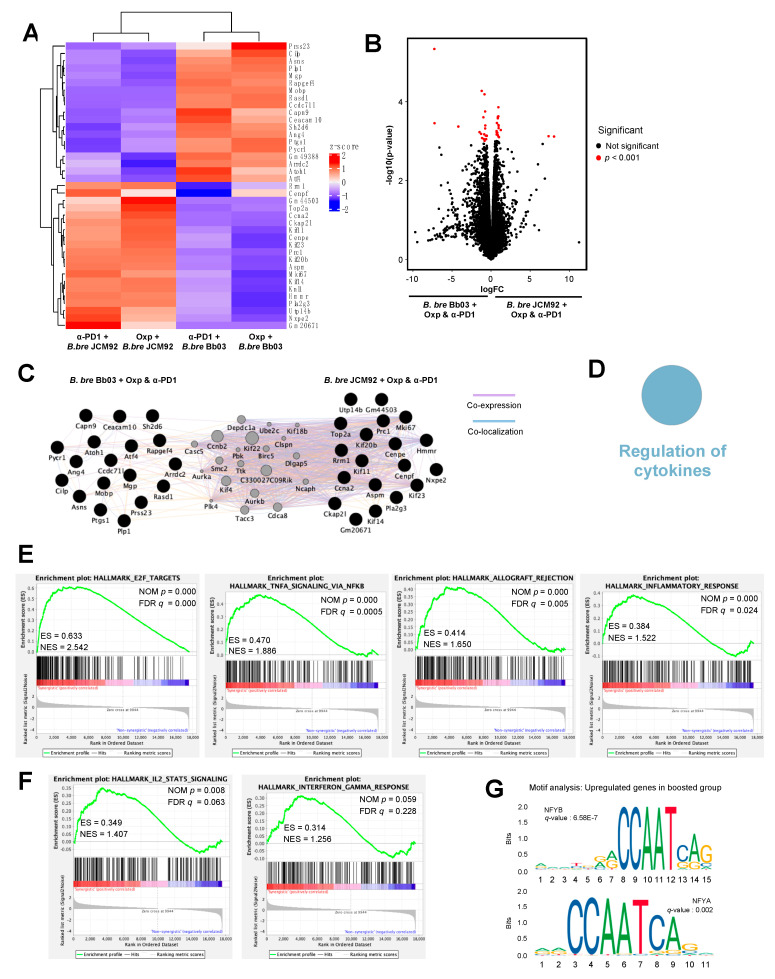
Figure 6.
Effect of cancer therapeutics and B. breve strains on the intestinal transcriptome. (A) Heat map showing hierarchical clustering of differentially expressed genes (DEGs) between mice treated with cancer therapeutics (oxaliplatin or PD-1 blockade) and B. bre JCM92 or B. bre Bb03. (B) Volcano plots illustrating genes between mice treated with cancer therapeutics and B. bre JCM92 and mice treated with cancer therapeutics and B. bre Bb03. Red dots represent significantly different genes (p < 0.001). (C) Network analysis of DEGs from mice treated with cancer therapeutics and B. bre JCM92, and mice treated with cancer therapeutics and B. bre Bb03 using Cytoscape. Co-expressed and co-localized genes are indicated by purple and blue lines, respectively. (D) Representation of the ClueGO functional network analysis shows upregulated genes in mice treated with cancer therapeutics and B. bre JCM92 compared to mice treated with cancer therapeutics and B. bre Bb03. (E,F) GSEA of intestinal transcriptome data exhibited that mice treated with cancer therapeutics and B. bre JCM92 were significantly enriched in hallmark pathways compared to mice treated with cancer therapeutics and B. bre Bb03. (G) Motifs within upregulated genes of mice treated with cancer therapeutics and B. bre JCM92. NFYB, nuclear transcription factor Y subunit beta; NFYA, nuclear transcription factor Y subunit alpha.

