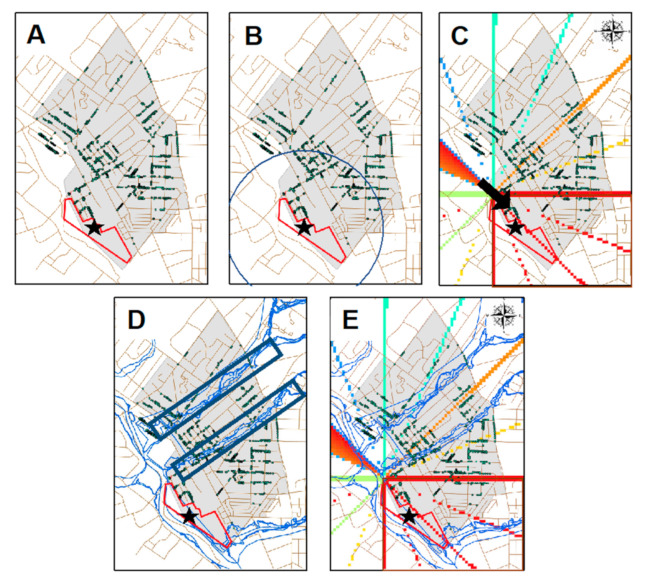
Figure 2.
Outline of geospatial methods to identify subjects and classify exposure. (A). The digitized Ambler map with the highlighted South Ambler Piles indicated by the red boundary and star, the grey area represents the Ambler township and each green dot represents a member of the cohort. (B). A representation of the techniques used in ArcMAP to stratify the cohort by distance. (C). A wind-rose established by historic records acquired from the National Ocean and Atmosphere Association was applied to the cohort; a SE prevalence wind was found, thus the SE members of the cohort were classified as downwind of the Ambler Piles. (D). The Federal Emergency Management Agency (FEMA) National Flood Hazards Layer within the Ambler township was overlaid and those members of the population within those flood zones were selected. (E). A subgroup of individuals (demarked by the magenta area) was selected to represent a portion of the cohort who experienced a concentrated amount of environmental asbestos exposure by being both in close proximity and downwind of the piles.

