Figure 4.
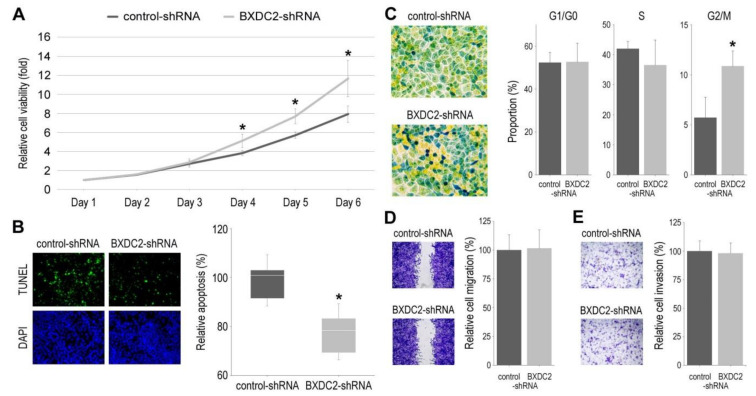
Effects of BXDC2 knockdown on the growth of bladder cancer cells. (A) MTT assay in 5637-control-shRNA vs. 5637-BXDC2-shRNA sublines cultured for 1–6 days. Cell viability is presented relative to that of control subline at day 1. Each value represents the mean (± SD) from a total of 6 determinants. (B) TUNEL assay in 5637-control-shRNA vs. 5637-BXDC2-shRNA sublines. Apoptosis counted as a percentage of at least 500 cells is presented relative to that of control subline. Each value represents the median (± SE) from a total of 16 determinants. (C) Cell cycle phase analysis in 5637-control-shRNA vs. 5637-BXDC2-shRNA sublines. Color changes are associated with cells in G0/G1 (yellow), S (green), and G2/M (blue) phases. Proportion of each phase counted as a percentage of more than 1.4 × 10⁶ cells represents the mean (+ SD). (D) Wound-healing assay in 5637-control-shRNA vs. 5637-BXDC2-shRNA sublines gently scratched and cultured for 24 h. Cell migration determined by the rate of cells filling the wound area is presented relative to that of control subline. Each value represents the mean (+ SD) from a total of 16 determinants. (E) Transwell invasion assay in 5637-control-shRNA vs. 5637-BXDC2-shRNA sublines. Cell invasion determined by counting the number of invaded cells in the lower chamber under a microscope is presented relative to that of control subline. Each value represents the mean (+ SD) from a total of 10 determinants. * p < 0.05 (vs. control-shRNA).

