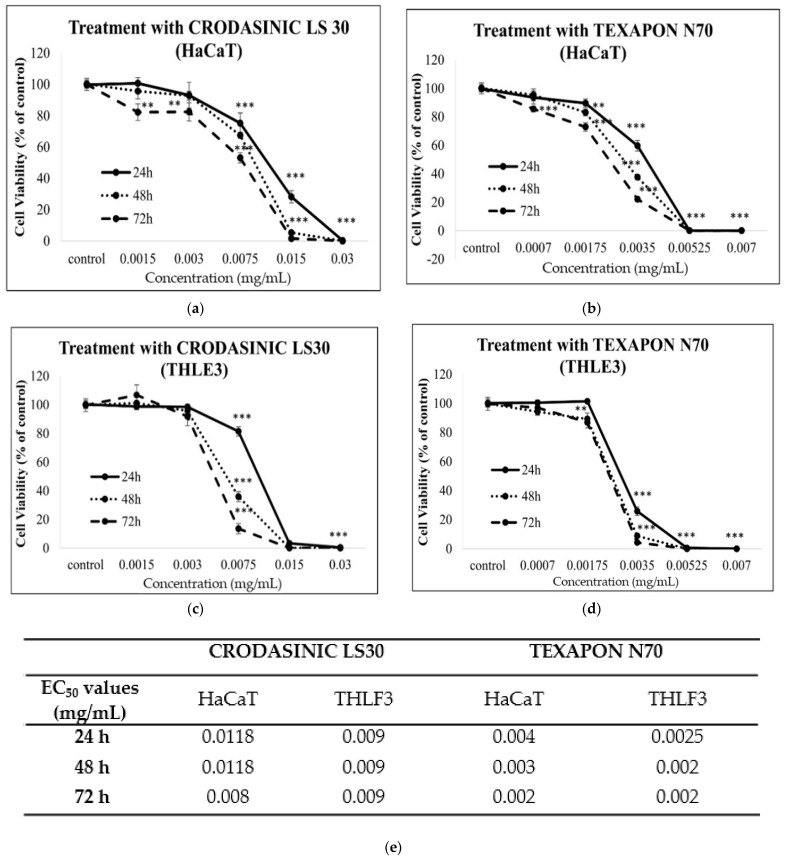
Figure 4.
Cytotoxicity profile of Crodasinic LS30 (a,c) and Texapon N70 (b,d) surfactants in in vitro skin and liver models. HaCaT and THLE3 cells were incubated with increasing concentrations (0.0015–0.03 mg/mL) of Crodasinic LS30 (a,c) and (0.0007–0.007 mg/mL) Texapon N70 (b,d) for 24, 48, or 72 h. Table showing EC50 values for all incubation periods (e). The viability of cells was determined by utilizing the alamar blue assay. The results are shown as the mean ± SD, and are representative from three independent experiments. Note: ** p < 0.01, *** p < 0.001 vs. control (untreated cells).

