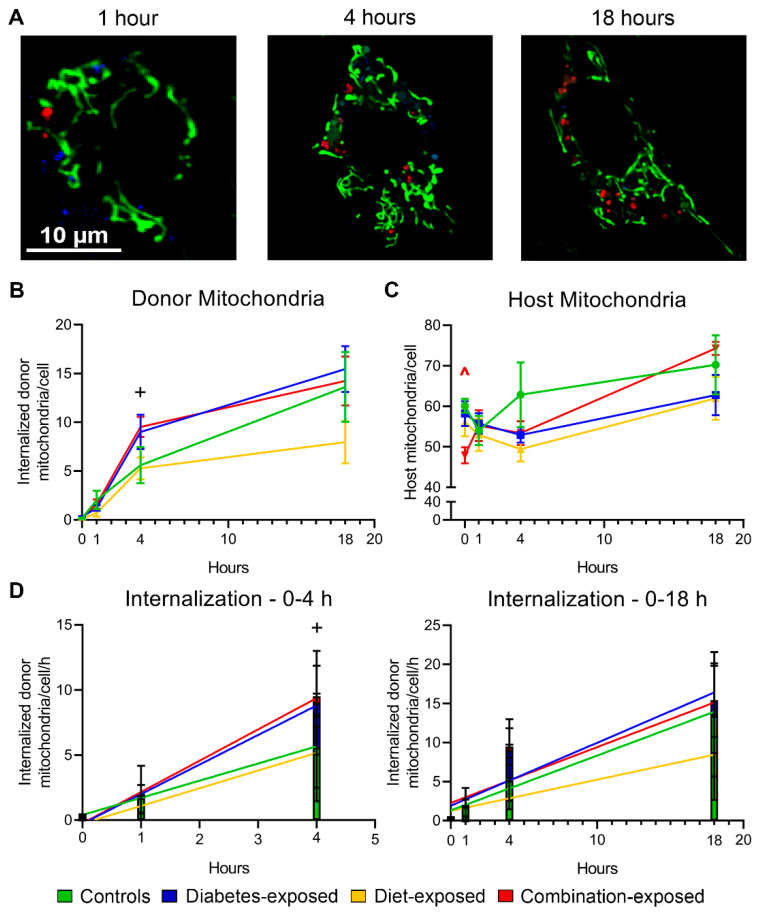
Figure 2.
Donor mitochondria are internalized by cardiomyocytes at faster rates with diabetes exposure. (A) Representative confocal live-cell images of MitoTracker Green- and LysoTracker Blue-stained cardiomyocytes co-incubated with pHrodo Red-stained donor mitochondria. Numbers of internalized donor mitochondria (B) and host mitochondria (C) over time. (D) Rates of donor mitochondria internalization in the first four hours of co-incubation (left) and across 18 h (right). Data represent mean ± SEM. N = 5–6 males/group. Significant differences (p ≤ 0.05): + diabetes effect by 2-way ANOVA, ^ group effect by 1-way ANOVA and Dunnett post hoc test when interaction was present by 2-way ANOVA.

