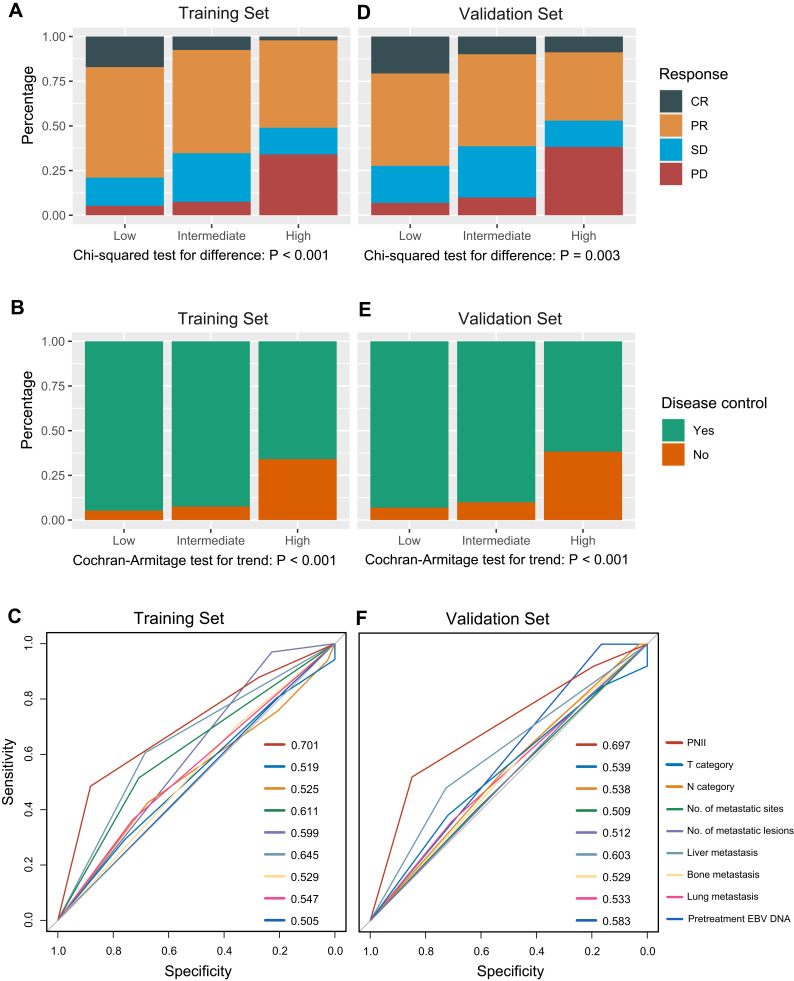
Figure 2.
The distribution of chemotherapy responses (A) and disease control (B) for each prognostic nutrition and inflammation index (PNII) category in the training cohort. The PNII score’s performance for predicting short-term disease control against other traditional baseline factors in the training cohort (C). The distribution of chemotherapy responses (D) and disease control (E) for each prognostic nutrition and inflammation index (PNII) category in the validation cohort. The PNII score’s performance for predicting short-term disease control against other traditional baseline factors in the validation cohort (F).

