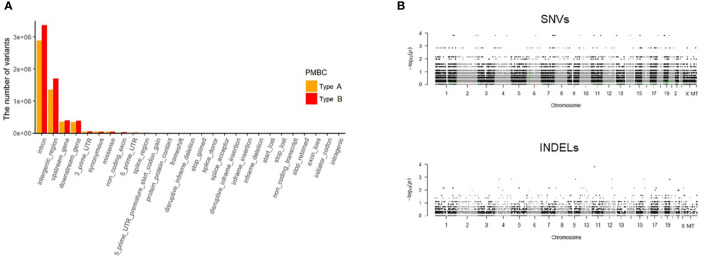
Figure 3.
Analysis of WES data according to classic paucicellular (Type A) and hypercellular (Type B) PMBC. (A) Regional differences of variants in Type A and B PMBC (B) Manhattan plot of single nucleotide variants (SNVs) and of insertions or deletions (INDELs). The y axis represents log-scaled p values.

