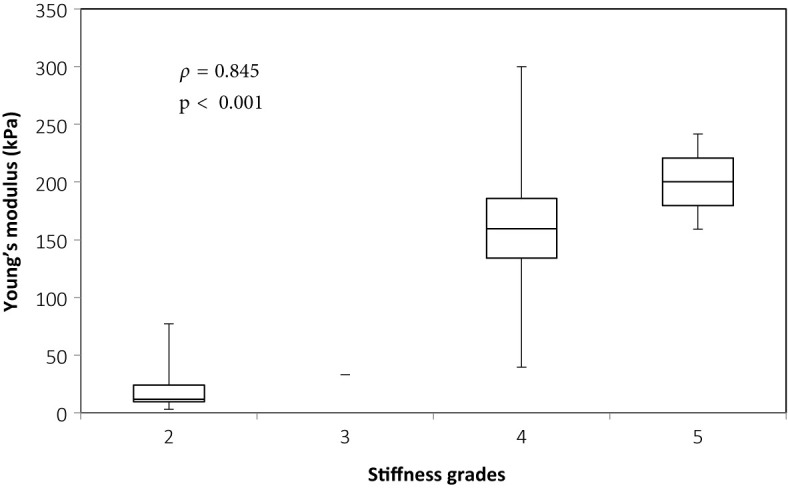
Figure 2.

Box and whiskers plot for Young’s modulus measurements according to stiffness grade assessed by independent surgical opinion (n = 34). The upper and lower bounds of the box were the third and first quartiles, respectively, while the line within the box was the median. The upper and lower whiskers were maximum and minimum values, respectively.
