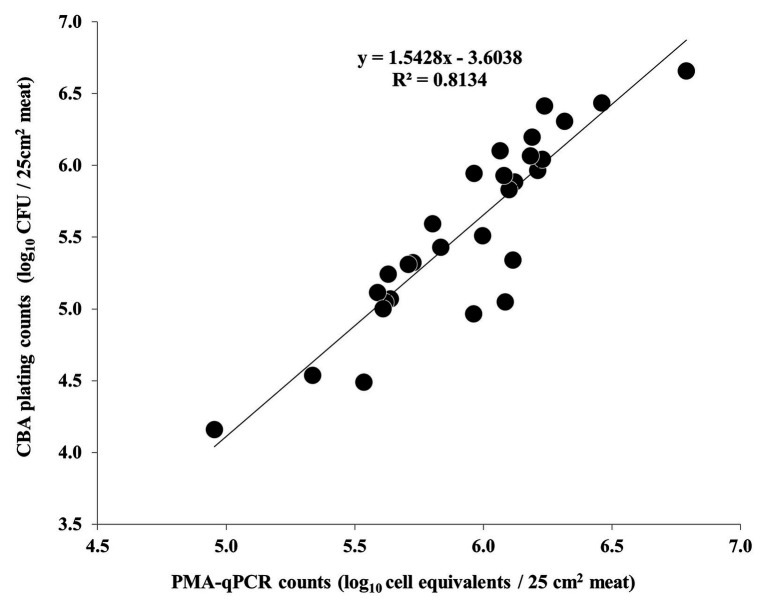
Figure 5.
Correlation of C. coli log10 cell equivalent counts obtained by PMA-qPCR and log10 CFU counts obtained by plating on CBA during the second and third independent experiments (each dot represents an individual meat sample). The linear regression equation and R2 value are shown in the diagram.

