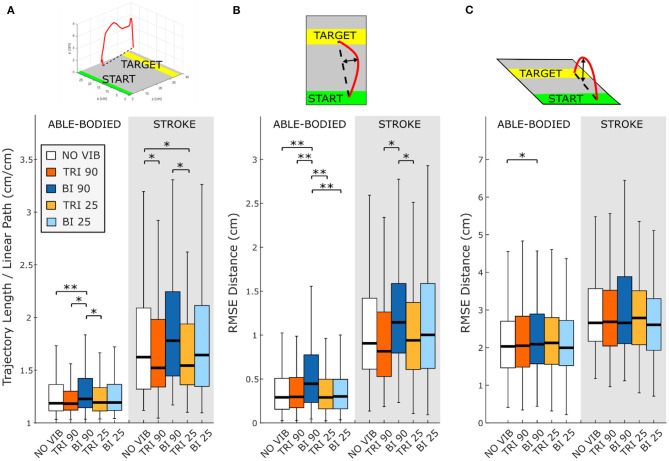
Figure 2.
Directness is measured by (A) the ratio between the length of the traveled trajectory and the length of a linear path between the starting and the final positions as well as the root mean square errors (RMSE) of the distance of the trajectory from the linear path projected in the (B) transverse plane and (C) sagittal plane. Higher values indicate a less direct trajectory. In each subplot medians and interquartile ranges [25th and 75th percentile (Q25, Q75)] with whiskers indicating the range of non-outlier values are shown for data aggregated across all participants and targets for both able-bodied and stroke patient participants when no vibration (white, NO VIB), 90 Hz vibration on the triceps (orange, TRI 90), 90 Hz vibration on the biceps (blue, BI 90), 25 Hz vibration on the triceps (yellow, TRI 25), and 25 Hz vibration on the biceps (light blue, BI 25) was applied. The statistical differences indicated (*p < 0.05, **p < 0.001) refer to the main effect of the experimental condition.

