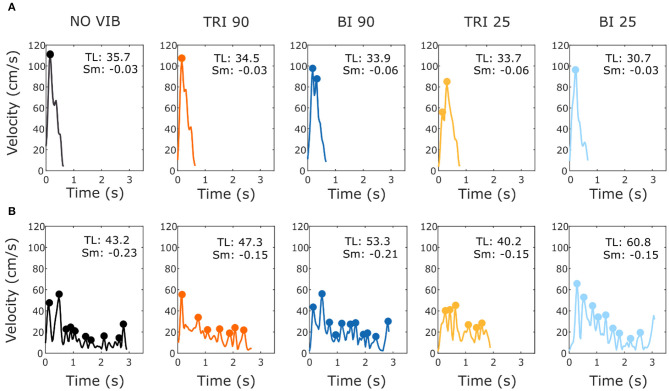
Figure 4.
Example velocity profiles from (A) one able-bodied participant and (B) one stroke patient for the five experimental conditions while reaching a target at 80% of the maximum reachable distance. The dots represent the local peaks with a minimum prominence of 5 cm/s. The numbers in the right corner of each graph represent the traveled trajectory length (TL) and the smoothness index (Sm: -n. peaks/trajectory length). Higher (less negative) smoothness index values indicate a smoother movement.

