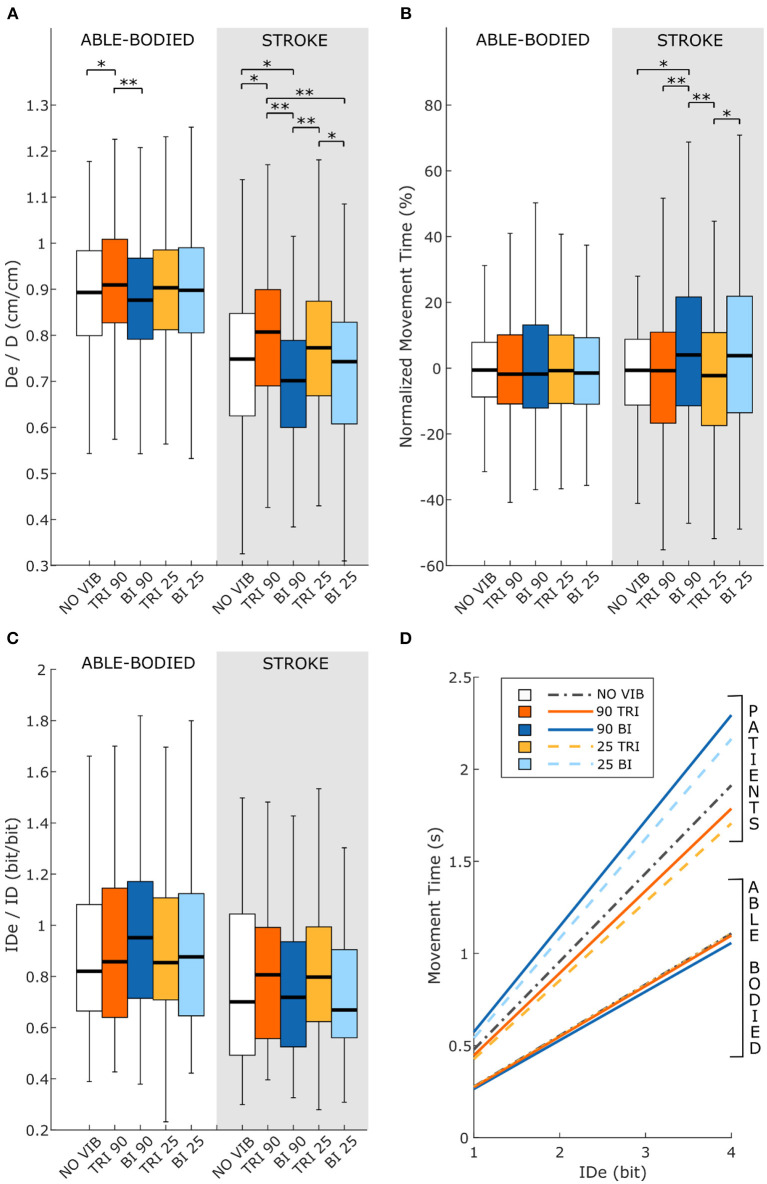
Figure 6.
Fitts' law parameters included (A) the expected over the prescribed target distance (De/D), (B) the normalized movement time, and (C) the ratio between the effective and prescribed index of difficulty (IDe/ID). In each subplot medians and interquartile ranges [25th and 75th percentile (Q25, Q75)] with whiskers indicating the range of non-outlier values are shown for data aggregated across all participants and targets for both able-bodied and stroke patient participants. The statistical differences indicated (*p < 0.05, **p < 0.001) refer to the main effect of the experimental condition. (D) The relationship between the movement time and the effective index of difficulty averaged across all participants in the two groups, stroke patients and able-bodied participants, is also shown. The slopes of the lines in (D) represent the inverse of the throughput, which is expressed in bit/s.

