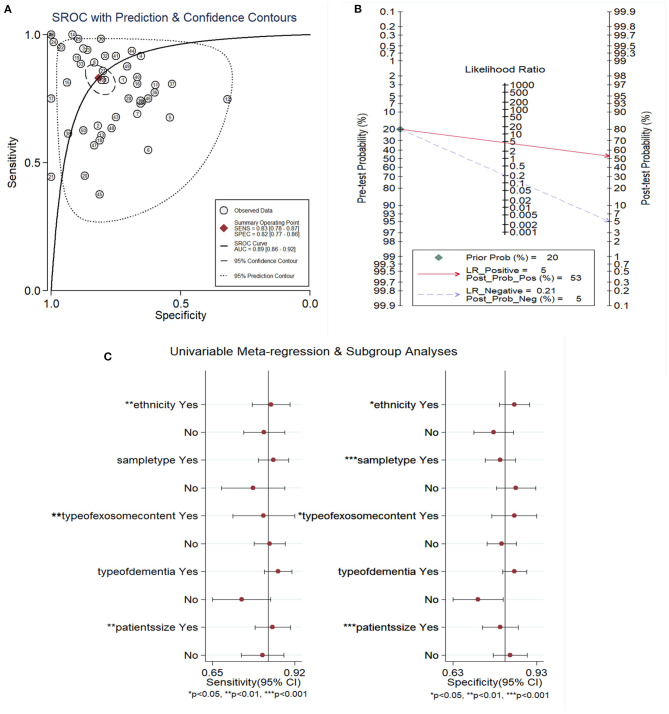
Figure 5.
The SROC (A) Fagan's nomogram assessing (B) and forest plot of covariates' meta-regression (C) of exosome-drived biomarkers for the diagnosis of AD and MCI. A: AUC, area under the curve; SENS, sensitivity; SPEC, specificity; SROC, summary receiver operator characteristic; AD, Alzheimer's disease; MCI, mild cognitive impairment.

