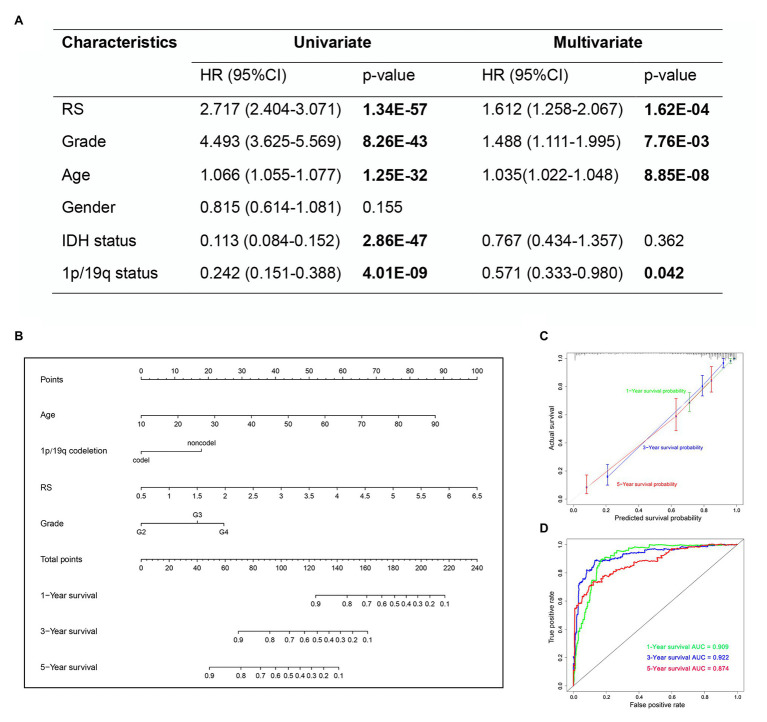
Figure 10.
The nomogram based on TCGA dataset for survival prediction in glioma patients. (A) Univariate and multivariate Cox regression analysis of clinical features. (B) Development a nomogram for the quantitative prediction of 1-, 3-, and 5-years survival for LGG patients. (C) The calibration curves for predicting glioma patient 1-, 3-, 5-years survival. (D) The 1-, 3-, and 5-year time-dependent ROC curves of the nomogram.

