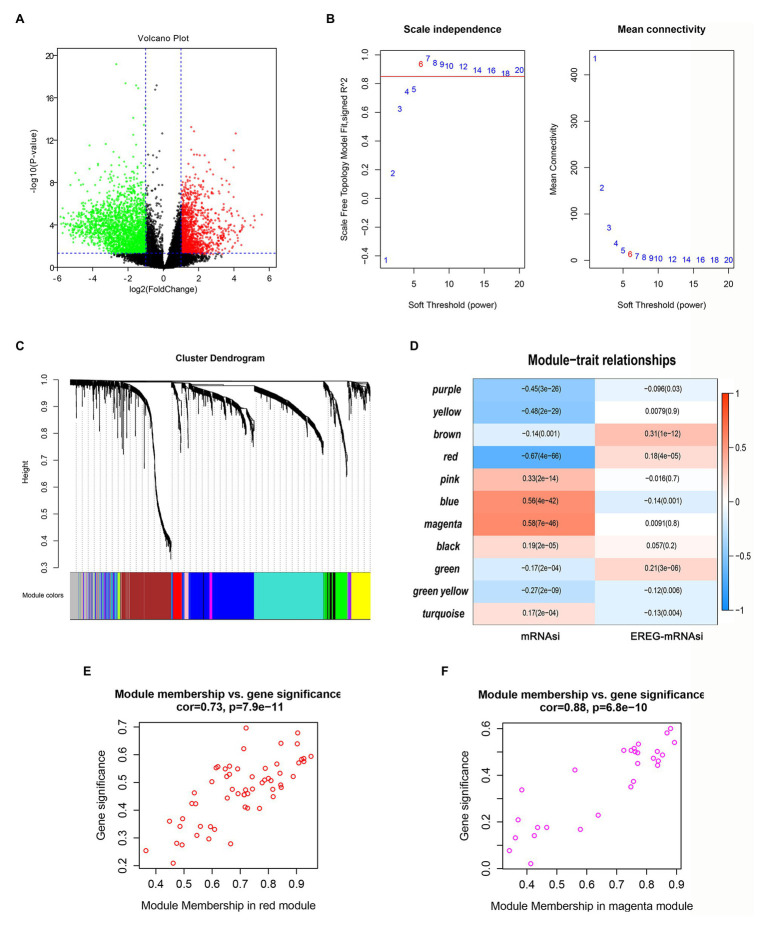
Figure 3.
Screening of critical genes related by mRNAsi. (A) Volcano plot of differentially expressed genes (DEGs); red represents upregulated genes, and green indicates downregulated genes. (B,C) Weighted gene correlation network analysis (WGCNA) of DEGs. Different colors represent different modules. (D) Correlation analysis of the modules and clinical traits with mRNAsi or EREG-mRNAsi. Scatter plot analysis of modules in the red (E) and magenta (F) modules.

