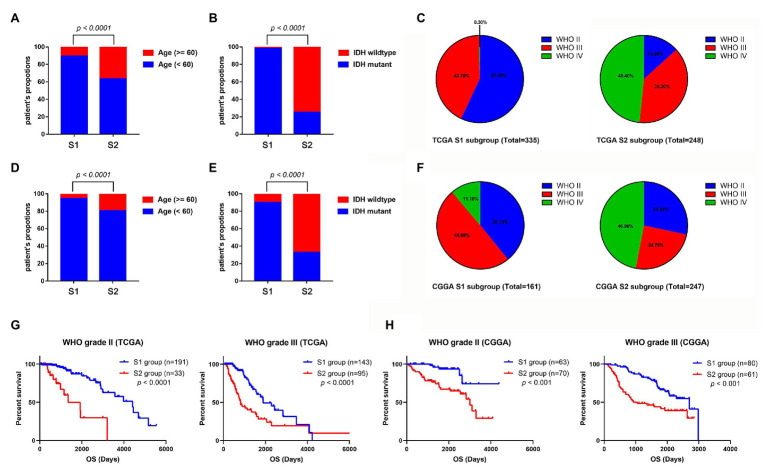
Figure 6.
Comparison of the clinical characteristics between the two subtypes using TCGA and CGGA datasets. Histograms to showing that the S2 group of TCGA dataset had significantly more elderly patients (A) and more patients with IDH wild-type (B). (C) Pie charts show that the S2 group of TCGA datasets has more patients with WHO grade IV glioma and fewer patients with WHO II glioma than the S1 group (p < 0.001). Histograms to show that the S2 group of CGGA dataset has significantly more elder patients (D) and more patients with IDH wild-type (E). (F) Pie charts show that the S2 group of TCGA datasets has more patients with WHO grade IV glioma and fewer patients with WHO II glioma than the S1 group (p < 0.001). (G) Kaplan-Meier survival curve of S1 and S2 group in different WHO grades (TCGA dataset). (H) Kaplan-Meier survival curve of S1 and S2 group in different WHO grades (TCGA dataset).

